Figures & data
Table 1. Comparison between mean age of patients in all groups.
Table 2. Comparison between the studied groups as regard laboratory data.
Figure 1. Comparison between anti-C1q antibodies in the three groups.
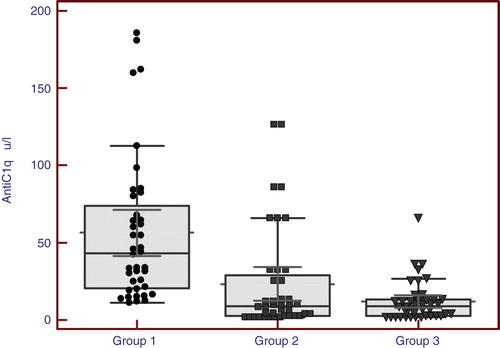
Table 3. Correlation between anti-C1q antibodies versus all variables among cases (group 1).
Figure 2. Correlation between anti-C1q antibodies versus C3, C4, Proteinuria, and renal SLEDAI and Activity index in cases (group 1).
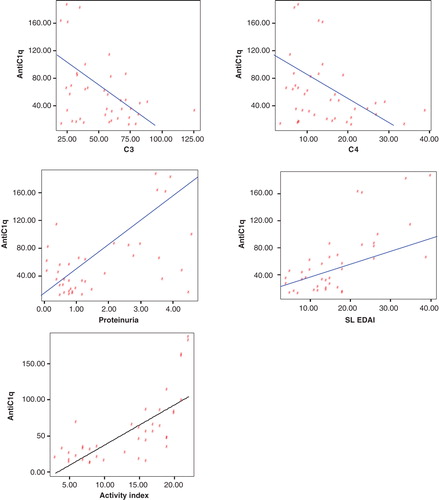
Table 4. Correlation between anti-C1q antibodies versus all variables among group without active lupus nephritis (group 2).
Figure 3. Correlation between anti-C1q antibodies and C3 among group without active lupus nephritis (group 2).
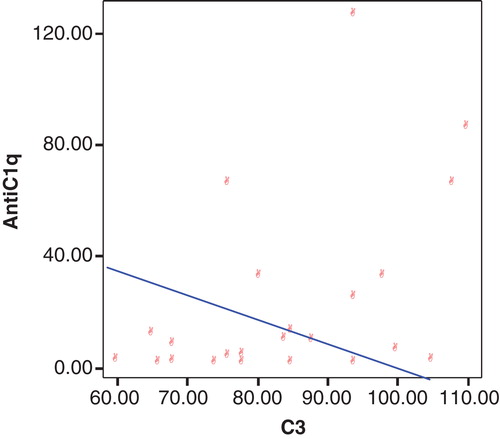
Table 5. Correlation between anti-C1q antibodies versus all variables among controls (group 3).
Table 6. Validity of anti-C1q antibodies in prediction of lupus nephritis in group 1 patients.
Figure 4. ROC curve for anti-C1q in lupus nephritis.
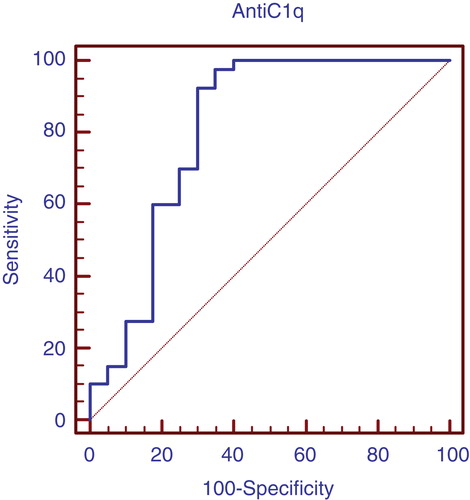
Table 7. Validity of C3 in prediction of lupus nephritis in group 1 patients.
Figure 5. ROC curve for C3 in lupus nephritis.
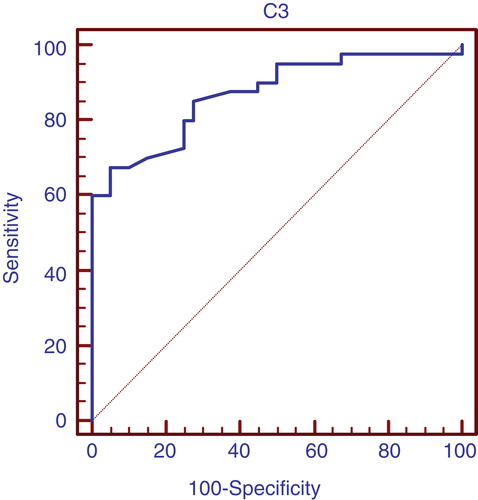
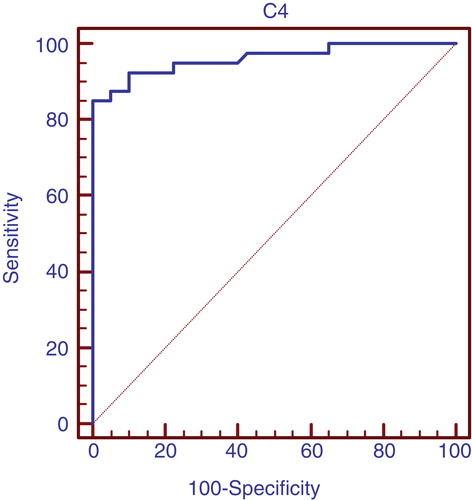
Table 8. Validity of C4 in prediction of lupus nephritis in group 1 patients.
Figure 6. ROC curve for C4 in lupus nephritis.