
Figures & data
Box 1. Drug summary.
Figure 1. rhASB plasma concentrations during and 2 h after the first infusion with the area under the plasma concentration-time curve (AUC0-t).
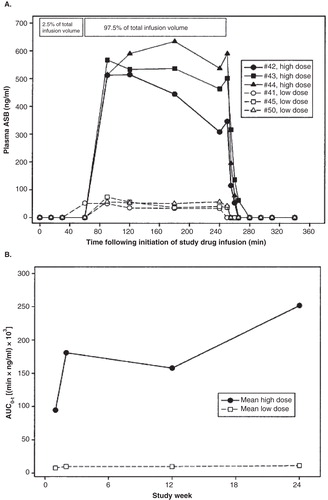
Table 1. Phase III study: summary of effect on primary and secondary endpoints.
Table 2. Summary of AEs during study weeks 1 – 48.
Table 3. Summary of study populations.