Figures & data
Figure 1. Examples of DNA methylation modifications on cytosines (C) of CpG dyads and the effects of these changes at the level of the gene and relationship to carcinogenesis. (A) Nucleotide C is shown on the left, this base can be methylated at position 5 of the aromatic ring by one of several DNMT to become 5-methyl cytosine shown on the right. The methylation is reversible and methyl modifications can be changed to hydroxymethyl or other groups or removed by various enzymes. (B) The gross effect of DNA hypermethylation in a gene promoter region, is to turn off transcription of the gene (shown by the curved arrow). Many tumor suppressor genes, such as APC and BCL2 are controlled by methylation, and if the genes are deactivated, then critical checks and balances in cells are removed, which can lead to apoptosis or to carcinogenesis. Similarly, oncogenes such as CCND2 can be activated by removal of methylation marks from important regulatory regions Citation[73,89]. (C) The methylation levels of a DNA region can be measured by several methods. One of the more comprehensive and convenient methods involves bisulfite conversion, which chemically changes nucleotide C into uracil (U). The U then pairs with adenine (A) and upon replication of DNA by PCR the nucleotide U is converted into thymine (T). This C to T change can be measured by sequencing and forms the basis of many DNA methylation quantitation tests. The affected C and T bases are shown in underlined boldface and a methylated C is shown as C*. The upper strand represents the native DNA sequence and the lower strand the same sequence replicated after PCR amplification.
![Figure 1. Examples of DNA methylation modifications on cytosines (C) of CpG dyads and the effects of these changes at the level of the gene and relationship to carcinogenesis. (A) Nucleotide C is shown on the left, this base can be methylated at position 5 of the aromatic ring by one of several DNMT to become 5-methyl cytosine shown on the right. The methylation is reversible and methyl modifications can be changed to hydroxymethyl or other groups or removed by various enzymes. (B) The gross effect of DNA hypermethylation in a gene promoter region, is to turn off transcription of the gene (shown by the curved arrow). Many tumor suppressor genes, such as APC and BCL2 are controlled by methylation, and if the genes are deactivated, then critical checks and balances in cells are removed, which can lead to apoptosis or to carcinogenesis. Similarly, oncogenes such as CCND2 can be activated by removal of methylation marks from important regulatory regions Citation[73,89]. (C) The methylation levels of a DNA region can be measured by several methods. One of the more comprehensive and convenient methods involves bisulfite conversion, which chemically changes nucleotide C into uracil (U). The U then pairs with adenine (A) and upon replication of DNA by PCR the nucleotide U is converted into thymine (T). This C to T change can be measured by sequencing and forms the basis of many DNA methylation quantitation tests. The affected C and T bases are shown in underlined boldface and a methylated C is shown as C*. The upper strand represents the native DNA sequence and the lower strand the same sequence replicated after PCR amplification.](/cms/asset/02d80529-eea5-4e0f-bf86-8a59eee0efee/iero_a_897610_f0001_b.jpg)
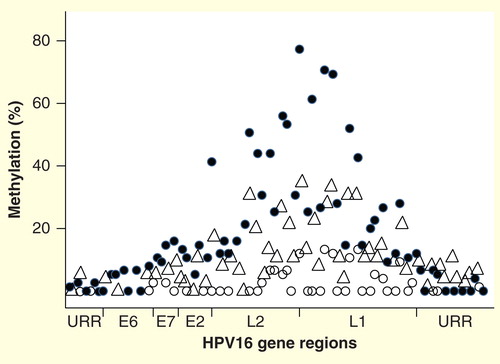
Figure 2. DNA methylation patterns across the genome of HPV16, showing the percentage median values for selected CpG sites in cancers (solid circles), cervical intraepthelial neoplasia 2/3 (triangles), and normal women who had transient HPV16 infections (open circles). Other hrHPVs have similar methylation patterns, with relative peaks in the L1 and L2 regions and little to no methylation in the URR. The circular genome is depicted as opened in the URR region. The specific peaks and valleys of the HPV16 genome methylation profile are quite reproducible in specimens from different geographic locations and may reflect the intrinsic relative positions of histones and other binding complexes.