Figures & data
Figure 1. Single-cell gene expression data. (A) Distribution of transcripts among like cells is skewed (B) and can be modeled with avlognormal distribution Citation[1], here, exemplified by the expression of GS in 258 primary astrocytes Citation[51]. (C) Transcripts are produced in bursts, with variable frequency and amplitude Citation[6]. The burst kinetic accounts for the lognormal distribution of transcripts among like cells.
![Figure 1. Single-cell gene expression data. (A) Distribution of transcripts among like cells is skewed (B) and can be modeled with avlognormal distribution Citation[1], here, exemplified by the expression of GS in 258 primary astrocytes Citation[51]. (C) Transcripts are produced in bursts, with variable frequency and amplitude Citation[6]. The burst kinetic accounts for the lognormal distribution of transcripts among like cells.](/cms/asset/b9652599-24a9-4b37-9334-3923340e70d9/iero_a_901154_f0001_b.jpg)
Figure 2. Overview of single-cell gene expression profiling by real-time quantitative PCR. Sample collection, cell dissociation and purification are study dependent steps.
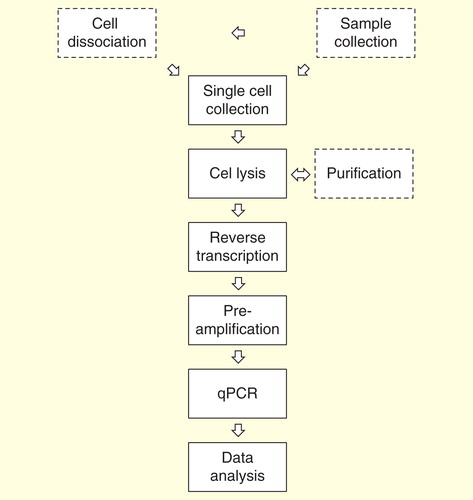
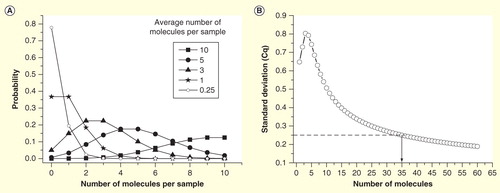
Figure 3. Sampling ambiguity due to Poisson distribution. (A) The probability to obtain a certain number of target molecules in an aliquoted volume, when the sample (average) concentration is 10, 5, 3, 1 and 0.25 target molecules per volume. (B) Expected standard deviation of Cq values of replicates as function of the average number of molecules per reaction volume. Off-scale data are ignored, which produces a maximum around three molecules. For comparison, SD of a typical qPCR within its dynamic range is indicated (SD = 0.25 cycles).