Figures & data
Figure 1. First-line and second-line natalizumab treatment pathway for JC-virus-negative RRMS patients.
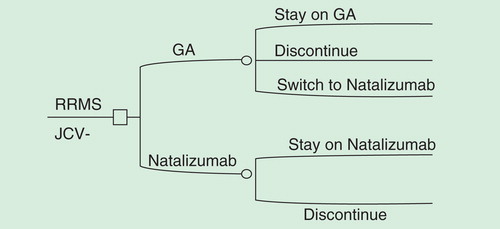
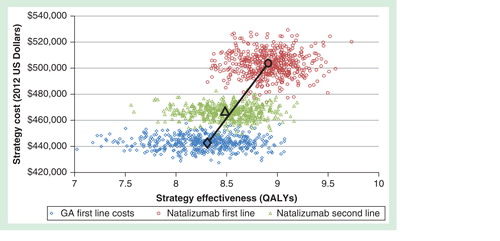
Figure 2. Efficiency frontier showing results from the 1000 Monte Carlo draws and the base-case incremental cost–effectiveness ratios (ICERs) for each strategy. Natalizumab second-line is subject to extended dominance as the mean ICER lies to the left of the efficiency frontier defined by the line connecting the non-dominated options, natalizumab first-line and GA first-line. As compared with GA first line, the ICER for natalizumab second line was greater (i.e., more costs per health unit gained) than the ICER for natalizumab first line.