Figures & data
Figure 1. Freeze sensitivity and heat stability of traditional vaccines.
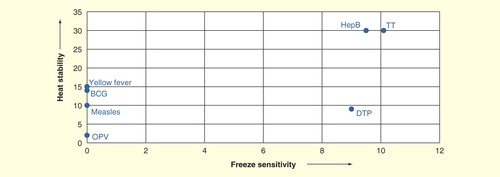
Figure 2. Freeze sensitivity and heat stability of new vaccines.
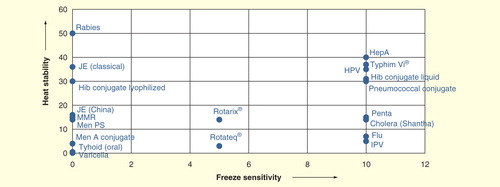
Table 1. WHO-recommended temperature monitoring devices for storage and transportation of vaccines.
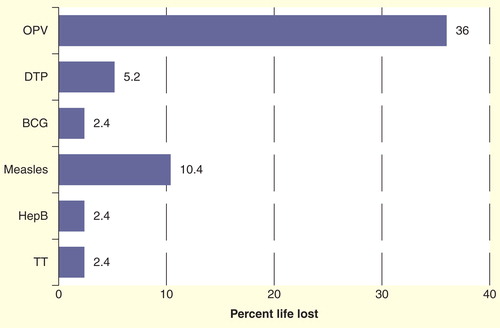
Figure 3. Temperature impact on life loss of vaccines calculated on the basis of vaccine vial monitor reaction. Each transportation is assumed to be done at a continuous temperature of +43°C for a period of 48 h with a minimum temperature reading inside the vaccine transport box recorded as 11.5°C, a maximum of 25.3°C and an average of 18.9°C throughout each journey. This scenario was repeated four times.