
Figures & data
Figure 1. Proportion of human proteins detected by UniProt evidence category. The percentage of proteins identified within each of the five UniProt evidence codes by the Wilhelm analysis,[Citation2] the Kim analysis [Citation1] and by the Ezkurdia et al. analysis.[Citation14] We calculated the evidence codes from the Kim analysis by mapping all 292,000 peptides detected by Kim et al. to the GENCODE annotation [Citation15] in the same manner as the Kim analysis. The Kim analysis would have identified 18,230 genes if they had searched against the GENCODE annotation in the same way as they searched against the RefSeq database.[Citation9]
![Figure 1. Proportion of human proteins detected by UniProt evidence category. The percentage of proteins identified within each of the five UniProt evidence codes by the Wilhelm analysis,[Citation2] the Kim analysis [Citation1] and by the Ezkurdia et al. analysis.[Citation14] We calculated the evidence codes from the Kim analysis by mapping all 292,000 peptides detected by Kim et al. to the GENCODE annotation [Citation15] in the same manner as the Kim analysis. The Kim analysis would have identified 18,230 genes if they had searched against the GENCODE annotation in the same way as they searched against the RefSeq database.[Citation9]](/cms/asset/9874f0e9-8d9b-47d1-aca6-32a2d5006945/ieru_a_1103186_f0001_oc.jpg)
Figure 2. Illustrating the difference between a good and a poor peptide-spectrum match. (A) A good peptide-spectrum match for the peptide VILHLKEDQTEYLEER, a peptide shared by HSP90AB1 and by several other genes. Note that almost all the b-series ions and the y-series ions in the image and in the legend on the right have been correctly identified (correct identification is indicated by the color and by the label in the image). (B) A poor peptide-spectrum match for the peptide MSGTNQAAVSEFLLLGLSR, a peptide that maps to the olfactory receptor OR1F1. Just three of the b-series ions and two of the y-series ions have been correctly mapped (again, shown by the label in the image and the color in the image and the legend on the right) and none of the correct mappings were consecutive. Both spectra came from ProteomicsDB.
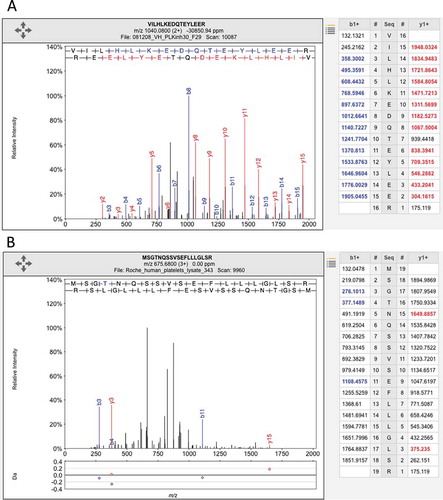
Figure 3. Illustrating how combining experiments increments the false discovery rate. The illustration shows the effect of combining two imaginary experiments, experiments 1 and 2. In the figure, the yellow boxes represent true positive peptide hits, the pink boxes represent false positive peptide identifications. The real peptide false positive rate for both experiments 1 and 2 is 10% (one false positive event in 10). However, when the two imaginary experiments are combined, the number of true positive hits only rises to 11 because 7 of the peptides were identified in both experiments. The false positive identifications were not the same in both experiments, so the real peptide false positive rate rises to 15.39% (2 in 13). In general, many of the true positive peptide hits are repeated across experiments and few of the false positive identifications are repeated, so the false discovery rate will always go up when experiments are combined – and the more experiments that are combined, the greater the effect as it gets harder and harder to identify peptides that have not previously been identified in another experiment.
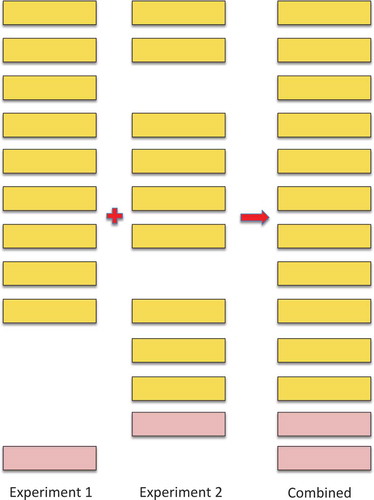
Figure 4. Examples of the many poor spectra from the Kim analysis. (A) One of the two very poor spectra used to identify peptide TISFGGCVVQIFFIHAVGGTEMVLLIAMAFDRYVAICKPLHYLTIMNPQR for gene OR4F6. The Mascot scores of the two matches are very low, 3.22 and 2.57, only a handful of ions are properly identified. (B) A very poor spectrum for the peptide DVAVVFTEEELELLDSTQRQLYQDVMQENFR, which is the only peptide that identifies gene ZNF229. Only the y-series is shown for this +4 charge spectrum, very few y-series ions are identified. (C) A very poor spectrum for peptide MGYFLKLYAYVNSHSLFVWVCDR, which is used to identify EBLN2. Here just a single ion is identified. It is worth noting that this peptide is supposed to have both an N-terminal acetylation. All these spectra are from the Human Proteome Map from the Kim analysis.
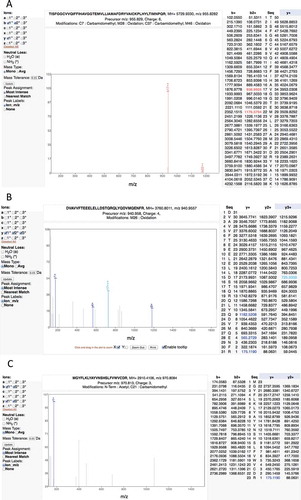
Figure 5. Examples of the many poor spectra from the Wilhelm analysis. (A) One of the three poor spectra used to identify peptide VGLSSPR for gene LINC00346. This peptide was identified with an Andromeda score of 71.95. No consecutive ions in the series were identified. (B) The very poor spectrum for peptide MRPQPRGGSGR, which maps to gene LINC00346. The peptide is supposed to be N-terminal acetylated. None of the fragments are identified. C. One of three poor spectra for peptide SYKRSFRMILNK, which is used to identify EBLN2. Again very few fragments are identified. All these spectra are from the ProteomicsDB and from the Wilhelm analysis.
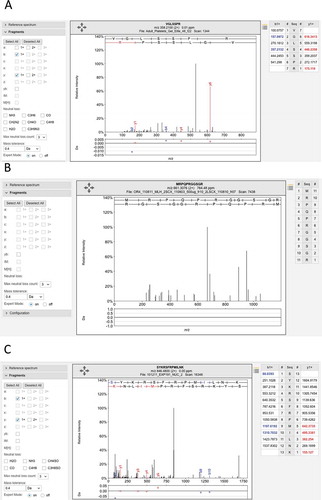
Figure 6. Poor spectrum with a delta score of>10. One of two poor spectra that identify peptide GQGVPISCK for gene LINC00346. This peptide was identified with Mascot delta score of 17.95, but the Mascot score was just 24.02, a score that is worse than the 5% local peptide cutoff used in the main study. Again few ions in the two series are identified.
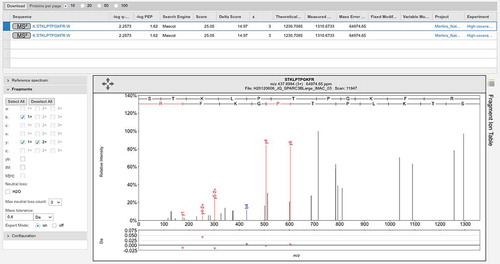
Table 1. A list of the novel coding regions identified from the Pandey analysis by more than one peptide that is not already annotated in one of the main genome databases.
Table 2. A list of the most significant GO terms from those genes that appeared only in cell line experiments and those that appeared in the Kim and Wilhelm tissue-based analyses.