Figures & data
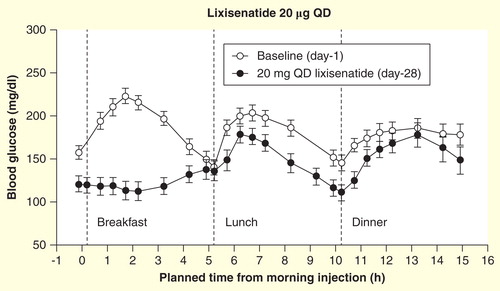
Figure 1. Sixteen-hour blood glucose concentrations in response to standardized meals at breakfast, lunch and dinner at baseline and day 28 in patients (n = 21) with Type 2 diabetes after administration of lixisenatide. Data are mean ± standard error.