
Figures & data
Figure 1. Subject disposition.
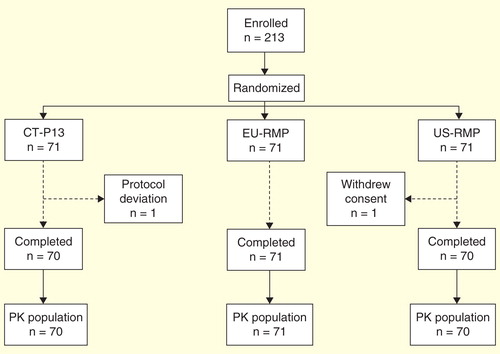
Table 1. Baseline subject demographics (safety analysis set).
Figure 2. Mean ± standard deviation serum concentrations of three formulations of infliximab over time.
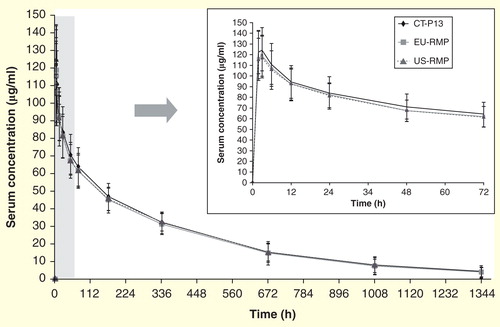
Table 2. Primary pharmacokinetic end points between three formulations of infliximab: CT-P13, EU-RMP and US-RMP.
Table 3. Mean (± standard deviation) values for the secondary pharmacokinetic end points (pharmacokinetic analysis set).
Table 4. Treatment-related TEAEs. Data are shown for TEAEs that occurred in ≥3% of subjects in any treatment group (safety analysis set).