
Figures & data
Figure 1. The relationship between functional status (measured using the Health Assessment Questionnaire [HAQ]) and a generic health-related quality of life measure (EQ-5D) in rheumatoid arthritis. As HAQ increases (i.e., outcomes worsen), so quality of life (determined by EQ-5D) also decreases Citation[9,10].
![Figure 1. The relationship between functional status (measured using the Health Assessment Questionnaire [HAQ]) and a generic health-related quality of life measure (EQ-5D) in rheumatoid arthritis. As HAQ increases (i.e., outcomes worsen), so quality of life (determined by EQ-5D) also decreases Citation[9,10].](/cms/asset/b6040b71-3434-4f12-86ae-6c0b6cf3ac39/ierm_a_1090313_f0001_b.jpg)
Figure 2. The annual costs of rheumatoid arthritis within Europe and the USA, subdivided into categories.
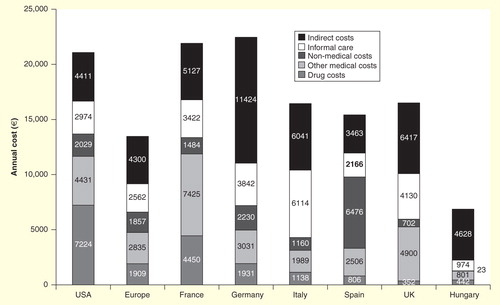
Figure 3. The relationship between access to biologic therapies for rheumatoid arthritis and per-capita GDP within the WHO European Region (international dollars). The size of the bubbles is proportional to each country’s population.
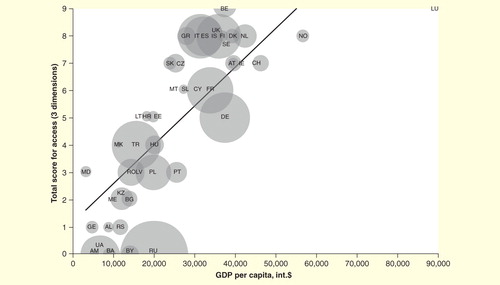
Table 1. Predicted budget impact of introduction of CT-P13 for the treatment of rheumatoid arthritis in the UK, Italy, France and Germany, based on three different scenarios regarding discount relative to the ‘reference medicinal product’ and percentage market uptake.
Table 2. Predicted budget impact of the introduction of CT-P13 for the treatment of rheumatoid arthritis in Bulgaria, the Czech Republic, Hungary, Poland, Romania and Slovakia based on two different scenarios over 3 years.