Figures & data
Information from Citation[27].
![Figure 1. Simplified optical principle of reflectance confocal microscopy illustrating the way of the light from the point light source to the skin and onto the detector.Information from Citation[27].](/cms/asset/6476b741-7c78-414d-8d5e-f2c754b81bb9/ierg_a_11208268_f0001_b.jpg)
(A) Nests of tumor cells in the dermis, elongated shape of cells and nuclei (arrow), dark spaces in between tumor nodules and surrounding collagen correspond to clefts on histopathology. (B) Large, dilated blood vessels adjacent to dermal tumor nest (arrow) with highly reflective white cells in the center of the vessel correspond to erythrocytes. (C) Polarization of cells (arrow). (D) Representative hematoxylin and eosin histology of basal cell carcinoma with nests of basaloid tumor cells, clefting and blood vessel dilatation (arrow).
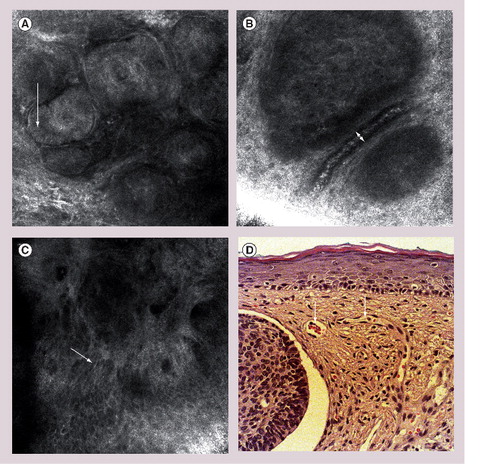
The formation of the collagen along the same axis resembles the arrangement of tumour cells in basal cell carcinoma (streaming).
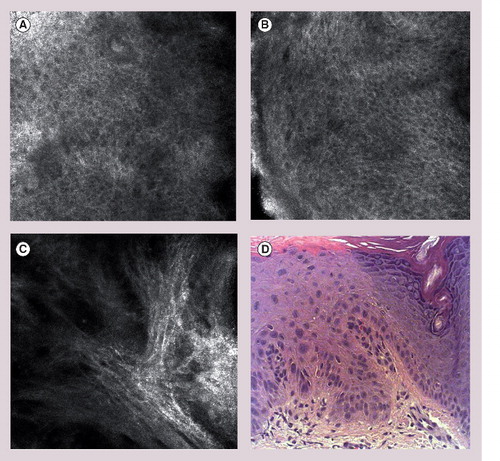
(A & B) Loss of normal epidermal honeycomb pattern, architectural diarray, cellular atypia and pleomorphism. (C) Marked solar elastosis in the upper dermis. (D) Representative hematoxylin and eosin histology of actinic keratoses with proliferation of atypical keratinocytes (‘crowding’).