
Figures & data
Figure 1. Causes of anemia in the cancer patient.
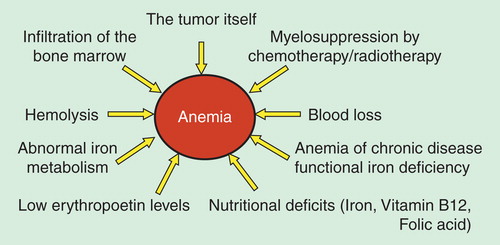
Figure 1. Physiopathology of anemia of chronic diseases.
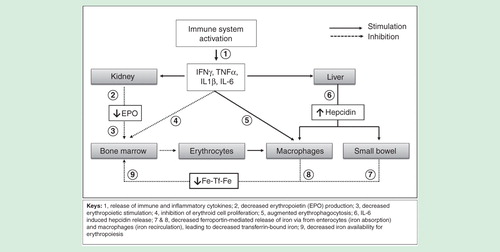
Table 1. Comparative cost-efficacy of different iv. iron formulation for treating IBD-associated anemia.
Table 1. Demographic characteristics.
Table 2. Details of costs per patient.
Table 3. Summary of main results.
Table 4. Median monthly costs in Euros for each treatment group.
Table 1. Preoperative correction of anemia of “Management of severe perioperative bleeding ESA Guidelines”.
Table 2. Summary of recommendations related to anemia of the Spanish Update Consensus Document on alternatives to reduce allogeneic blood transfusion (in descending order of strength).
Figure 1. Graphical representation for hematochemical parameters of all patients at the end of the three different treatment periods (iv1, os, iv2). (A) Hemoglobin variations during the study (Hb). (B) Transferrin Saturation (TSAT). (C) C-reactive protein (CRP). D: Erythropoietin weekly consumption (Epo).
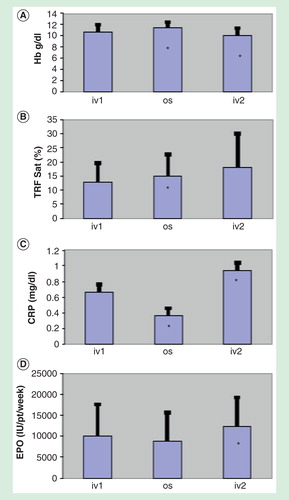
Figure 1. The histogram explains the efficacy of Sideral® Forte showing a mean increase of Hb levels of 1.26 g/dl (9.96–11.22 g/dl, p = 0.0309), ferritin levels of 49.946 ng/mL (42.839–92.785 ng/ml, p = 0.2105), of sO2 of 1.1% (95.2–96.3%, p = 0.3365) and a mean decrease of HR of −2 (85.4–83,4 HR, p = 0.3843).
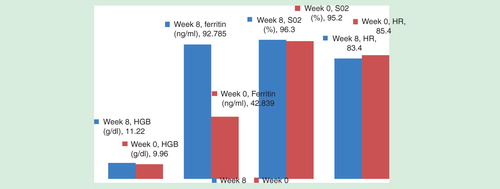
Table 1. Quality of Life FACT Questionnaire- An Version 04 Modified Fatigue Scale (normal range: 0–28).
Figure 2. The histogram shows an improvement of the quality of life after 8 weeks of treatment with Sideral® Forte (20.4–11.6, p = 0.0088).
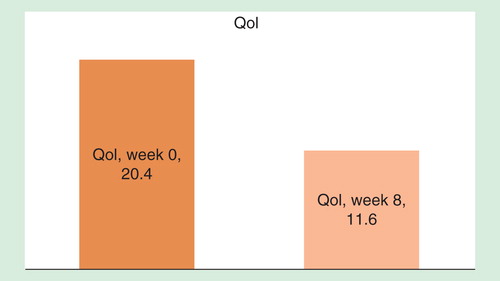
Table 1. Women aged 27–41 years (n = 4).
Table 2. Men aged 31–45 years (n = 5).
Table 3. Both sexes patients aged 27–45 years (n = 9).
Table 1. Anthropometric measure in recruited patients.
Table 2. Anthropometric, hematologic measures and autoimmunity response in CD patients.
Table 3. Anthropometric, hematologic measures and autoimmunity response in NCSG patients.
Table 4. Liposomal iron supplementation in NCSG patients.
Table 1. Characteristics of analysed patients.
Table 1. Characteristics of analysed patient.
Table 1. Characteristics of analysed patients.
Table 1. Type of gastrointrestinal disease considered with number of patients.
Figure 1. (A) Hemoglobin levels according to age. No statistical difference was found between the different age groups. (B) MCV values according to age. MCV values were significantly lower in children aged >2-6 years and in those older than 10 years. (C) Ferritin values according to the age. Ferritin values were significantly lower in children older than 10 years.
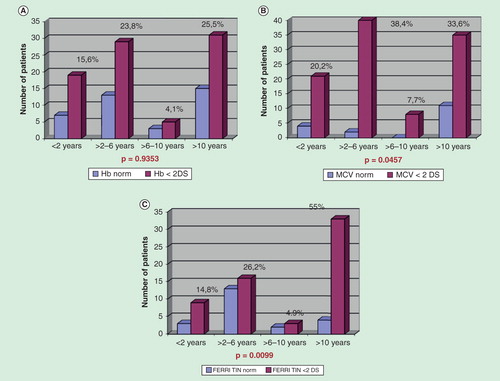
Figure 1. Average Hb g/dl improvement.
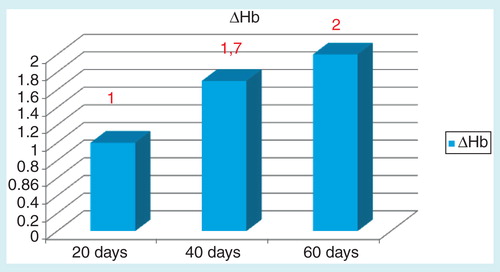
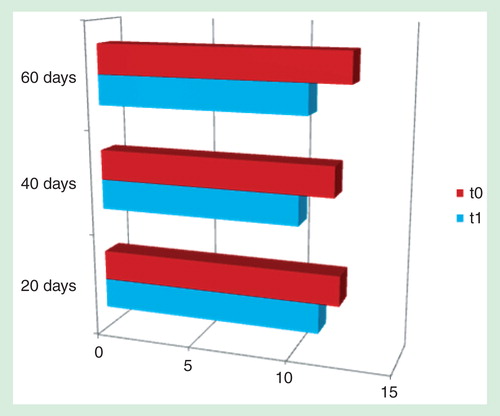
Figure 2. Response Hb(t0)/Hb(t1).
Group A
Group B
Group C