
Figures & data
Figure 1. MyD88 dependent and Myd88 independent signaling pathways for the TLRs and helicases. A. Intracellular pathways for MyD88 independent TLR3 nuclear signal transduction initiated by TRIF binding to the TIR of the TLR3 homodimer. TLR3 monomers dimerize with binding of the dsRNA ligand. Activated TRIF initiates two pathways. The first results in the transitory induction of the IFNs. The second is a species variable pathway (rodents ≫primates) that operates though NFκB (dashed line), which transiently induces the production of inflammatory cytokines. The adapter protein cascade initiated by TRIF (TIR-domain-containing adapter-inducing interferon) includes TBK1 (TANK-binding kinase 1 binds to TRAF3), TRAF1/3 (TNF receptor associated factors), NAP1 (Nck-associated protein 1), IKK (IκB kinase), IKKε (inhibitor of IκB kinase), P13K (Phosphoinositide 3-kinase), IRF3/7 (interferon regulatory transcription factors), TAK1 (protein kinase of MLK family), TAB1 (TGF-β activated kinase 1), RIP1 (Receptor-interacting [TNFRSF] kinase 1), NFκB (nuclear factor kappa-light-chain-enhancer of activated B cells), IκB (inhibitor NFkB). The ectodomain of TLR3 consists of a horseshoe shaped structure populated by 23 leucine-rich β-sheets (orange disks) connected by non-ordered chains containing RNA binding residues. The transmembrane a-helices (solid orange) connect the ectodomain to the cytoplasmic TIR domain (dark green). The phosphorylated TIR binds TRIF to initiate the adapter protein cascade. B. Intracellular pathways for MyD88 dependent for TLR 1/2 and 1/6 heterodimers and TLR 4–10 homodimers with the diverse PAMP ligands represented by a green bar is not necessarily as accurate in placement as is dsRNA with TLR3 in 1A. TLR4 uses both the MyD88 dependent and independent pathways. Reproduced from Mitchell WM, et al .Discordant Biological and Toxicological Species Responses to TLR3 Activation. Am J Path 2014; 184: 1062–72.
![Figure 1. MyD88 dependent and Myd88 independent signaling pathways for the TLRs and helicases. A. Intracellular pathways for MyD88 independent TLR3 nuclear signal transduction initiated by TRIF binding to the TIR of the TLR3 homodimer. TLR3 monomers dimerize with binding of the dsRNA ligand. Activated TRIF initiates two pathways. The first results in the transitory induction of the IFNs. The second is a species variable pathway (rodents ≫primates) that operates though NFκB (dashed line), which transiently induces the production of inflammatory cytokines. The adapter protein cascade initiated by TRIF (TIR-domain-containing adapter-inducing interferon) includes TBK1 (TANK-binding kinase 1 binds to TRAF3), TRAF1/3 (TNF receptor associated factors), NAP1 (Nck-associated protein 1), IKK (IκB kinase), IKKε (inhibitor of IκB kinase), P13K (Phosphoinositide 3-kinase), IRF3/7 (interferon regulatory transcription factors), TAK1 (protein kinase of MLK family), TAB1 (TGF-β activated kinase 1), RIP1 (Receptor-interacting [TNFRSF] kinase 1), NFκB (nuclear factor kappa-light-chain-enhancer of activated B cells), IκB (inhibitor NFkB). The ectodomain of TLR3 consists of a horseshoe shaped structure populated by 23 leucine-rich β-sheets (orange disks) connected by non-ordered chains containing RNA binding residues. The transmembrane a-helices (solid orange) connect the ectodomain to the cytoplasmic TIR domain (dark green). The phosphorylated TIR binds TRIF to initiate the adapter protein cascade. B. Intracellular pathways for MyD88 dependent for TLR 1/2 and 1/6 heterodimers and TLR 4–10 homodimers with the diverse PAMP ligands represented by a green bar is not necessarily as accurate in placement as is dsRNA with TLR3 in 1A. TLR4 uses both the MyD88 dependent and independent pathways. Reproduced from Mitchell WM, et al .Discordant Biological and Toxicological Species Responses to TLR3 Activation. Am J Path 2014; 184: 1062–72.](/cms/asset/2c4a9b81-8a76-48e4-aa92-f30f14a36e48/ierj_a_1172960_f0001_c.jpg)
Table 1. Characteristics and specifications for clinical grade rintatolimod.
Figure 2. Diagramatic representation of rintatolimod. The dsRNA structure is maintained by hydrogen bonding. The introduction of a uracil into the poly C strand provides thermodynamic instability with an increased susceptibility to blood nuclease hydrolysis. The poly I strand is represented by blue (inosine). The poly C12U bases are represented by green (cytosine) and red (uracil).
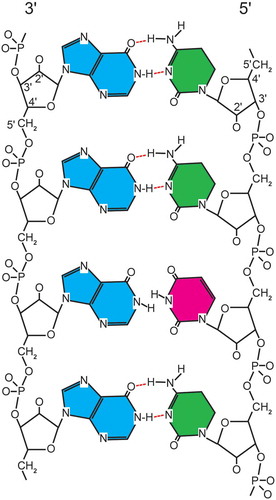
Figure 3. Representative rintatolimod blood elimination curves: (a) 200 mg (n = 6), (b) 400 mg (n = 12), and (c) 700 mg (n = 4) dose groups. Rintatolimod was delivered as a single bolus over an infusion period of 23–60 minutes. Rintatolimod and its metabolites (>50–100 nucleotides) were determined by hybridization employing a [3H]poly(C) probe. Each point is the average of duplicate concentration determinations at the designated dose and within 2.5 minutes of the time indicated. Each curve is the product of ‘n’ infusions, using first order decay kinetics. Revised from the doctoral thesis of Kenneth Strauss [Citation25] with permission from the author.
![Figure 3. Representative rintatolimod blood elimination curves: (a) 200 mg (n = 6), (b) 400 mg (n = 12), and (c) 700 mg (n = 4) dose groups. Rintatolimod was delivered as a single bolus over an infusion period of 23–60 minutes. Rintatolimod and its metabolites (>50–100 nucleotides) were determined by hybridization employing a [3H]poly(C) probe. Each point is the average of duplicate concentration determinations at the designated dose and within 2.5 minutes of the time indicated. Each curve is the product of ‘n’ infusions, using first order decay kinetics. Revised from the doctoral thesis of Kenneth Strauss [Citation25] with permission from the author.](/cms/asset/6d6dd255-fa2f-4a5f-a6bf-23db4648a879/ierj_a_1172960_f0003_b.gif)
Figure 4. Molecular Model of the human TLR3 dimer ecodomain and its rintatolimod ligand. Figure 4(a) is viewed from a lateral view of rintatolimod bound to the active site of the TLR3 homodimer. The C-terminal regions of each dimer face each other and bind to the phosphate backbone of the dsRNA. The N-terminals of each TLR3 bind to opposite ends of the dsRNA with a minimum length of 45 bp required for interaction with essential residues of TLR3 for activation of intracellular signaling. Amino acids of TLR3 required for binding of rintatolimod are shown as CPK (Van der Waals’ radii) associated with the phosphate backbone. Figure 4(b) illustrates the TLR3 homodimer complexed with rintatolimod as seen down the long axis of the dsRNA. The TLR3 homodimers are represented as structural elements with the blue arrows signifying direction of β-sheets and the red cylinders signifying α-helices. The Poly I strand of rintatolimod is colored blue and the poly C12U strand magenta. Reproduced from Mitchell WM, et al. Discordant Biological and Toxicological Species Responses to TLR3 Activation. Am J Path 2014; 184: 1062–72.
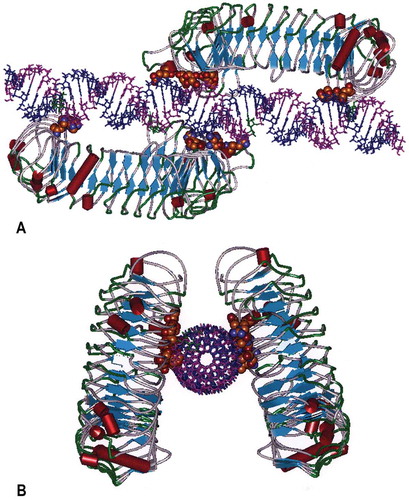
Table 2. Rintatolimod open-label studies.
Table 3. Rintatolimod placebo-controlled studies [Citation43,Citation44].
Table 4. AMP-502 clinical trial differential responsesa.
Table 5. AMP-502 differential medication usages.
Table 6. AMP-502-relative incidence of hospitalizationsa in CFS/ME patients receiving rintatolimod vs. placebo.
Table 7. AMP-516 analysis of the effect of rintatolimod on the primary endpoint, Exercise Tolerance (ET) [Citation43,Citation44].
Figure 5. AMP-516 plot of ET difference from baseline in seconds at 40 weeks treatment (ordinate) per each patient (abscissa). Plot of ET difference from baseline in seconds at 40 weeks treatment (ordinate) per each patient (abscissa). Reproduced from Strayer et al. Chronic Fatigue Syndrome/ Myalgic Encephalomyelitis (CFS/ME): Characteristics of responders to Rintatolimod. J Drug Res Dev 2015;1: doi http://dx.doiorg/10.16966/jdrd.103.
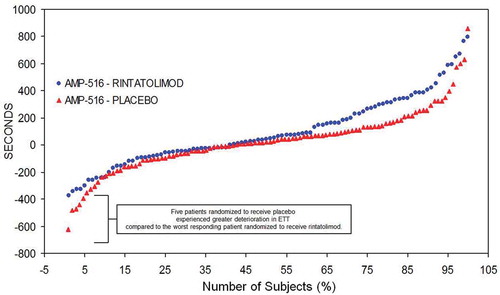
Table 8. Analysis of percentage of CFS/ME patients improving ET by at least 25% and 50% from baseline [Citation43].
Table 9. AMP-516 maximal oxygen utilization (VO2 max) in >9 minute baseline cohort.
Table 10. Summary of all patients with adverse events with at least 5% difference between rintatolimod and placebo.
Table 11. Relationship of SAEs to study drug as determined by blinded investigators.
Table 12. Comparative species sensitivity to rintatolimoda. [Citation20].
Table 13. Rintatolimod mutagenic potential.
Table 14. Evidence-based potential diagnostic markers for rintatolimod response in CFS/ME.