Figures & data
The dotted line at 3 cm illustrates that at ≤3 cm the prevalence of pheochromocytoma is only 2%, whereas at >3cm the prevalence is 8.3%.
Data taken from Citation[25].
![Figure 1. Frequency distribution of adrenal incidentalomas by size (cm); incidentally discovered pheochromocytomas are shown in hatched area.The dotted line at 3 cm illustrates that at ≤3 cm the prevalence of pheochromocytoma is only 2%, whereas at >3cm the prevalence is 8.3%.Data taken from Citation[25].](/cms/asset/4af8a3dc-f302-4706-a0ee-82a3d0d5866d/iere_a_11207973_f0001_b.jpg)
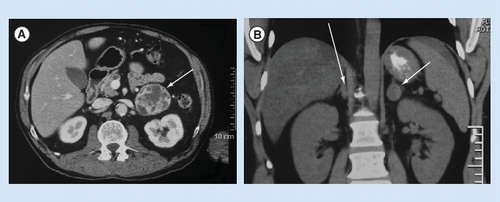
(A) Left pheochromocytoma. Abdominal CT scan from an asymptomatic man aged 65 years showing a heterogenous left adrenal mass, 6 cm (arrow). (B) Bilateral pheochromocytoma. Abdominal CT scan from a man aged 35 years with known MEN2, showing a left adrenal mass, 2 cm with density of >25 Hounsfield units (thick arrow), and thickened medial limb of the right adrenal gland (thin arrow).
Data taken from Citation[3] (closed bars) Citation[4], (open bars) and Citation[5] (hatched bars). Amar et al. Citation[3] had expressed temporal trend by chronological quartiles and these have been approximately re-expressed as decades as shown parenthetically.
![Figure 3. Three surgical series showing temporal change in the proportion of pheochromocytomas that had been diagnosed on the basis of incidental imaging finding.Data taken from Citation[3] (closed bars) Citation[4], (open bars) and Citation[5] (hatched bars). Amar et al. Citation[3] had expressed temporal trend by chronological quartiles and these have been approximately re-expressed as decades as shown parenthetically.](/cms/asset/c6db1337-e342-4042-925c-a4b90b93fe00/iere_a_11207973_f0003_b.jpg)