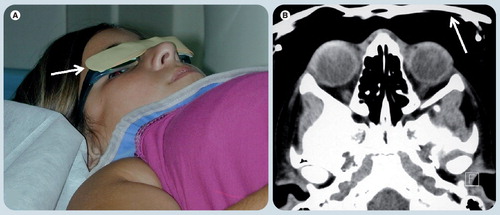
Figures & data
(A) Shows a child just before CT scanning with eyeglasses covered with a bismuth shield (white arrow) that protects from irradiation. (B) Axial CT soft tissue window at the level of the orbits demonstrate the bismuth shield with no underlying artifact in the image obtained.
Reprinted with permission from Elida Vazquez, MD, Hospital Materno-Infantil Vall d’Hebron, Barcelona, Spain.
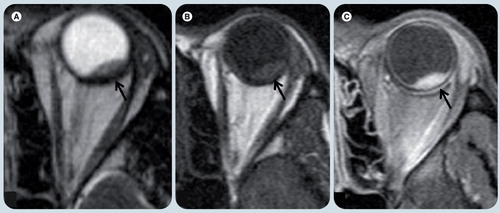
(A) Coronal T1-weighted image and (B) T2-weighted image with fat suppression show a right orbital floor fracture (arrow) with prolapsed orbital fat into adjacent right maxillary sinus.
Reprinted with permission from Citation[13].
![Figure 2. A 9-year-old boy with right orbital floor fracture.(A) Coronal T1-weighted image and (B) T2-weighted image with fat suppression show a right orbital floor fracture (arrow) with prolapsed orbital fat into adjacent right maxillary sinus.Reprinted with permission from Citation[13].](/cms/asset/d2b59b21-0594-4207-bd7a-00c4c1da0ed5/ierl_a_11211385_f0002_b.jpg)
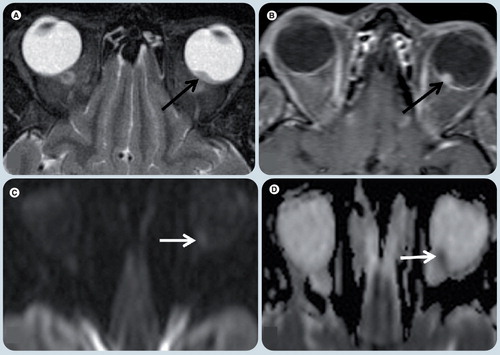
(A & C) Axial gradient echo T2* weighted images show dark signal intensity of ocular calcification corresponding with (B & D) hyperattenuated calcified spots on CT scans in the same patient.
Reprinted with permission from Citation[7].
![Figure 3. A case of right orbital retinoblastoma.(A & C) Axial gradient echo T2* weighted images show dark signal intensity of ocular calcification corresponding with (B & D) hyperattenuated calcified spots on CT scans in the same patient.Reprinted with permission from Citation[7].](/cms/asset/64db6243-2d19-4ff9-affb-c2094d02ef3a/ierl_a_11211385_f0003_b.jpg)
(A) Axial T1 weighted image shows a well-defined area of isointense signal (thick arrow) with focal mass effect and globe distortion medially (thin arrow), and a subtle area of internal high signal intensity (*) that suggests the lesion is complex. (B) Axial diffusion-weighted image shows markedly hyperintense signal (arrow), confirming area of focal abscess. (C) Axial T1-weighted contrast-enhanced image shows an ovoid area of nonenhancement (arrow) corresponding with area of restriction diffusion and representing pus.
Reprinted with permission from Citation[16].
![Figure 4. An 11-year-old girl with orbital cellulitis and extraconal abscess.(A) Axial T1 weighted image shows a well-defined area of isointense signal (thick arrow) with focal mass effect and globe distortion medially (thin arrow), and a subtle area of internal high signal intensity (*) that suggests the lesion is complex. (B) Axial diffusion-weighted image shows markedly hyperintense signal (arrow), confirming area of focal abscess. (C) Axial T1-weighted contrast-enhanced image shows an ovoid area of nonenhancement (arrow) corresponding with area of restriction diffusion and representing pus.Reprinted with permission from Citation[16].](/cms/asset/706cf2de-4bf1-4c81-8180-23dfc3d0a879/ierl_a_11211385_f0004_b.jpg)
(A) Diffusion-weighted imaging and (B) apparent diffusion coefficient map shows marked restricted diffusion (arrow) in the posterior portion of the right optic nerve when compared with the normal anterior aspect (arrowhead) of the nerve.
Reprinted with permission from Citation[18].
![Figure 5. A case of rhinocerebral mucormycosis with acute right optic nerve infarction.(A) Diffusion-weighted imaging and (B) apparent diffusion coefficient map shows marked restricted diffusion (arrow) in the posterior portion of the right optic nerve when compared with the normal anterior aspect (arrowhead) of the nerve.Reprinted with permission from Citation[18].](/cms/asset/f060b199-23c8-4dc5-8821-f9834689d849/ierl_a_11211385_f0005_b.jpg)
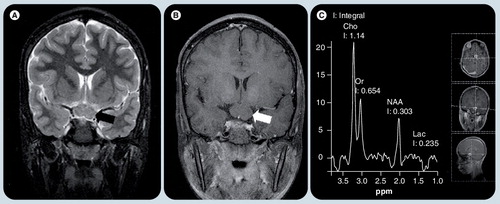
(A) Coronal T2-weighted image and (B) postcontrast T1-weighted image shows a well defined nonenhancing mass in the chiasm (arrows). (C) Single voxel MR spectroscopy placed on this lesion shows increased Cho peak and decreased NAA peak, implying high cellularity nature of the glioma. A small Lac is typical of pilocytic gliomas, which use glucose exclusively as their source of energy.
Cho: Choline; Lac: Lactate; NAA: N-acetyl aspartate; Or: .
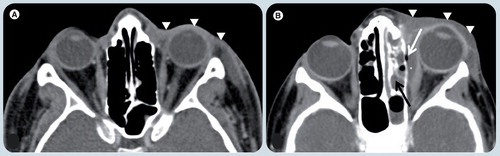
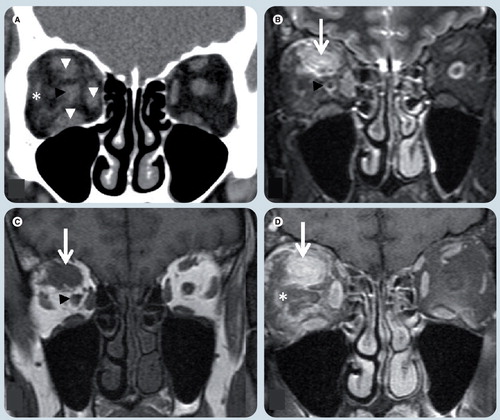
(A) Axial postcontrast soft tissue window CT image at the level of the orbits demonstrates diffuse thickening of soft tissues in the left preseptal region (white arrowheads). The postseptal region is normal. These signs together with the classical clinical history are diagnostic for preseptal cellulitis. (B) Axial postcontrast soft tissue window CT image in a different patient shows the diffuse thickening of soft tissues in left preseptal region (white arrowheads) extending to sclera, which enhances and is also thickened. A fusiform fluid collection (white asterisk) is depicted in the extraconal space, between the medial rectus muscle and the lamina papiracea with an air bubble (white arrow). The findings are compatible with an abscess. There is fluid in the ipsilateral ethmoid cells compatible with sinusitis (black arrow), which is the likely origin of the abscess.
(A) Coronal noncontrast soft tissue window CT image, (B) T2-weighted image (WI), (C) T1-WI and (D) T1-weighted fat-suppressed postgadolinium MR images. There is enlargement of the superior, medial and inferior rectus muscles (white arrowheads) more prominent in the superior one which shows an area of (B) T2 hyperintensity and (C) T1-WI isointensity relative to signal intensity of muscle and a poorly-defined area (white arrows) in its center. The ‘dirty fat’ sign is secondary to inflammatory changes in the intraconal fat (white asterisk). The optic nerve (black arrowheads) is shifted, but otherwise normal. The left orbit is unremarkable.
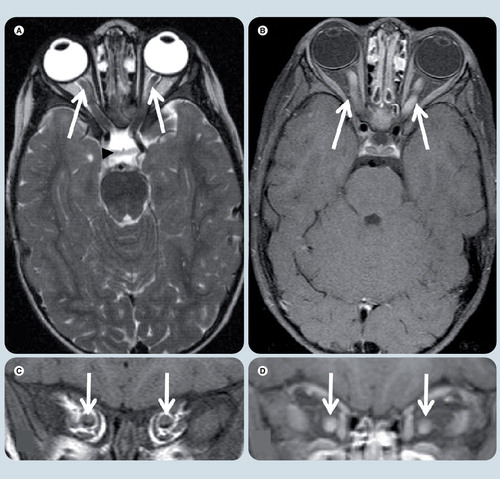
(A) Axial T2-weighted, (B) axial T1-weighted fat-suppressed postgadolinium, (C) coronal T1-weighted, and coronal T1-weighted fat-supressed postgadolinium (D) MRI at level of optic nerves. Symmetrical enlargement of both optic nerves with homogeneous contrast enhancement is seen (white arrows). The optic chiasm (black arrowhead) and the rest of the optic pathways are spared.
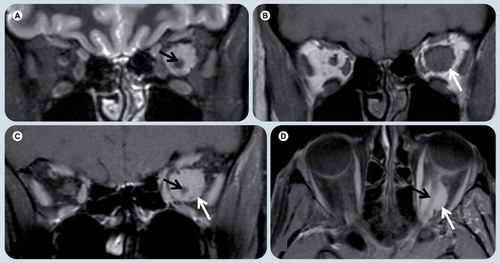
(A) Coronal T2-weighted image (WI), (B) T1-WI, (C) T1-WI fat-suppressed postgadolinium, and (D) axial T1-WI fat-suppressed postgadolinium MRI at level of the optic nerves. An intraconal, left orbital well-defined oval tumor (white arrows), which is (A) T2 hyperintense and (B) isointense on T1-WI relative to the optic nerve is present and (C & D) has avid contrast enhancement. (D) The optic nerve (black arrow) is seen within the mass and does not enhance, giving the typical ‘tramtrack’ sign on axial image.
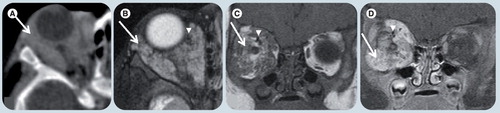
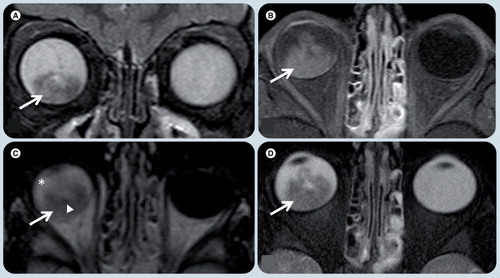
(A) Coronal T2-weighted, (B) axial T1-weighted fat-supressed postgadolinium, (C) axial FLAIR, and (D) axial T2-weighted MRI demonstrate a heterogeneous mass in the posterior and inferior right globe (white arrows). (A & D) The lesion is T2 hypointense with respect to the vitreous. (B) The tumor has marked enhancement after contrast administration. (C) On a FLAIR image the mass has heterogeneous signal intensity and the vitreous shows abnormal signal intensity (white asterisk), likely due to protein exudate. There are small foci of hyposignal in the mass (white arrowhead in (C)) that represent speckle calcifications.
Axial T2-weighted image (WI) (A), axial T1-WI fat-supressed post-gadolinium (B), diffusion weighted (C), and apparent diffusion coefficient map (D) MR images. A small single lesion (black arrow) is seen in the posterior and medial-center aspect of the left globe. It has low signal on T2-WI (A) relative to the vitreous and avid enhancement in postcontrast image (B). On diffusion WIs there is restricted diffusion in the mass (arrows) (C & D).
(A) Axial T2-weighted image (WI), (B) T1-weighted and (C) T1-weighted fat-supressed postgadolinium MRI show a small lesion in the posterior and lateral aspect of the left globe (black arrow). (A) The lesion is hypointense on T2-WI and (B) hyperintense on T1-WI relative to the vitreous and (C) shows avid enhancement after contrast administration. There were no other lesions. Patient’s history of prior primary lung carcinoma suggested the correct diagnosis.
(A) Axial postcontrast soft-tissue window CT image, (B) axial T2-weighted, (C) coronal T1-weighted image (WI), and (D) coronal T1-weighted fat-suppressed postgadolinium MR images demonstrate a poorly circumscribed and heterogeneous lesion (white arrows) in the right orbit involving several compartments. (B) The tumor is hyperintense on T2-WI and (C) isointense on T1-WI relative to the muscles. Intense enhancement is depicted in both (A) CT and (D) MRI. There are flow-voids (white arrowheads) corresponding to blood vessels. The lesion is causing expansion of the bony orbit suggesting slow growth, chronicity and proptosis.