Figures & data
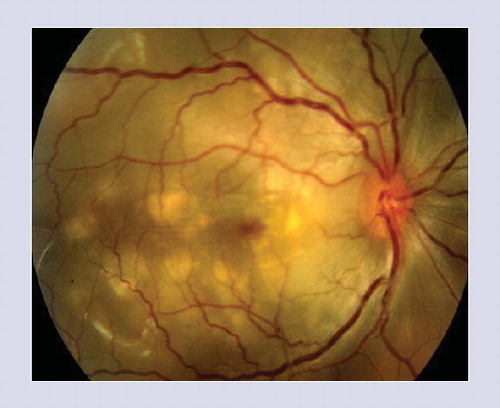
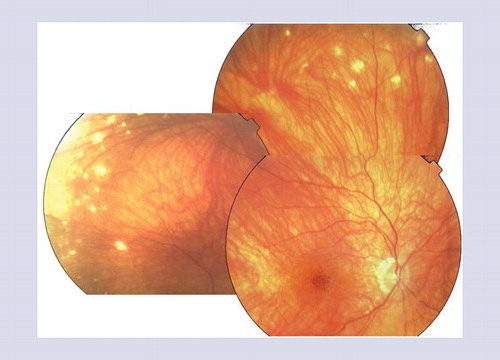
Note the presence of associated exudative retinal detachment, retinal folds and optic disc hyperemia.
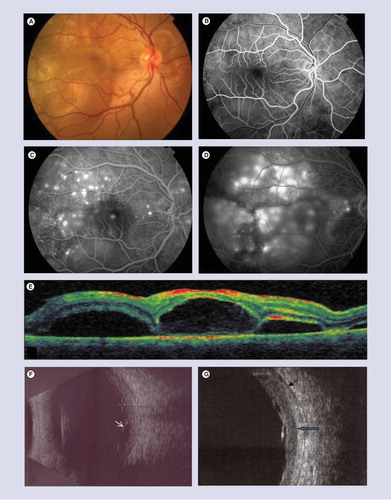
(A) Fundus photography shows bilateral exudative retinal detachment involving the posterior pole with associated retinal and choroidal folds. (B) Early-phase fluorescein angiogram shows areas of delayed choriocapillaris filling. (C) Mid-phase fluorescein angiogram shows multiple pinpoints that enlarge with pooling of dye in subretinal space in the late-phase (D). (E) Optical coherence tomography shows exudative retinal detachment with subretinal septa dividing the subretinal space into several compartments. (F) 10-MHz ultrasonography of the same patient shows diffuse-low to medium-reflective choroidal thickening most marked in the posterior fundus and associated exudative retinal detachment (white arrow). (G) 20-MHz ultrasonography shows better definition of sclero-choroidal limit (blue arrow) and episcleral space (black arrow) with more accurate measurement of choroidal thickening.
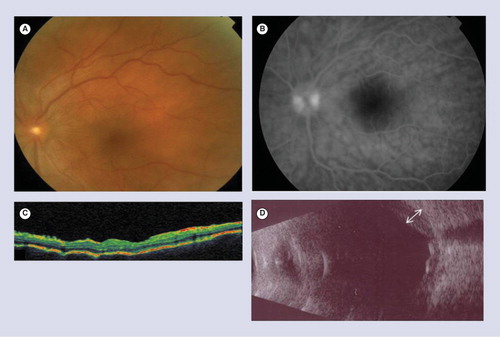
(A) Fundus photograph of left eye shows optic disc edema and retinal and choroidal folds. There is no evident exudative retinal detachment. (B) Early-phase fluorescein angiography shows hypofluorescent striae and optic disc hyperfluorescence. (C) Optical coherence tomography of the same eye shows multifocal folds of the retinal pigment epithelium and Bruch’s membrane. (D) 10-MHz ultrasonography shows diffuse medium reflective choroidal thickening (white arrow).
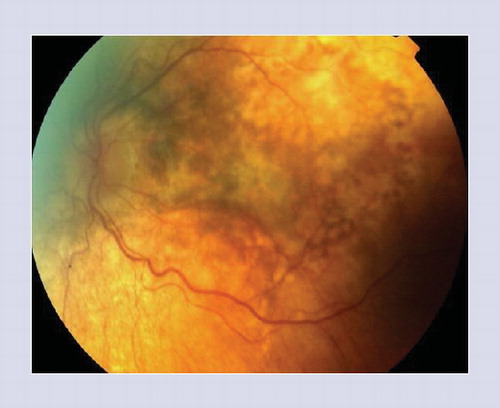
Note the presence of nummular, round, well-limited chorioretinal depigmented scars located in the midperiphery and focal hyperpigmentation in the foveal area.
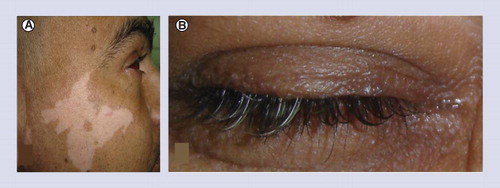
(A) Vitiligo on the face and (B) poliosis
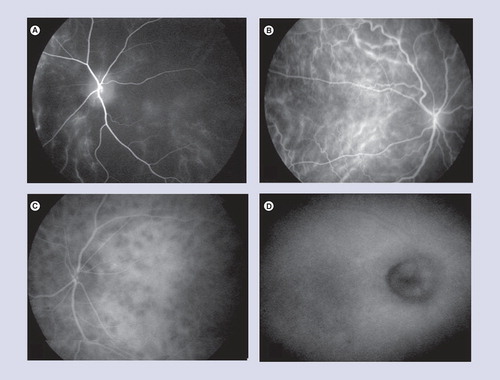
(A) Early-phase indocyanine green angiograms shows a marked choriocapillaris filling delay and (B) choroidal vascular fuzziness due to perivascular leakage. (C) Intermediate-phase indocyanine green angiography shows numerous hypofluorescent dark dots. (D) Late-phase indocyanine green angiography shows optic disc hyperfluorescence.