Figures & data
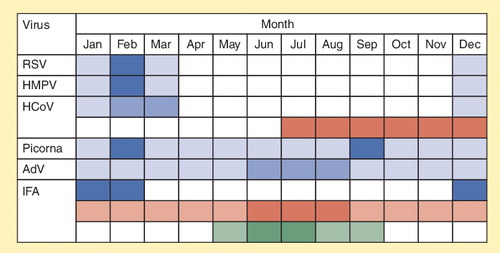
Intensity of color represents number of positive detections. Blue: temperate regions, Northern Hemisphere. Green: temperate regions, Southern Hemisphere. Red: tropical regions.
AdV: Adenoviruses; HCoV: Human coronaviruses; HMPV: Human metapneumovirus; IFA: Influenza virus A; RSV: Respiratory syncytial virus.
See section ‘Seasonal distribution of respiratory viruses’ for references.