Figures & data
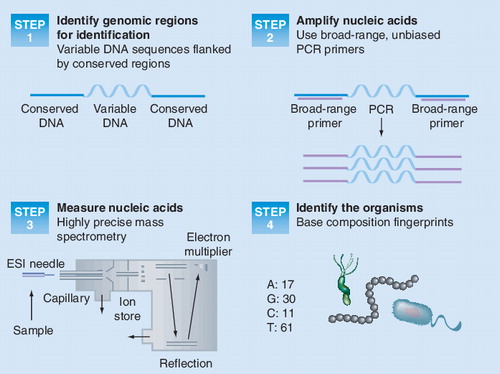
ESI: Electrospray ionization.
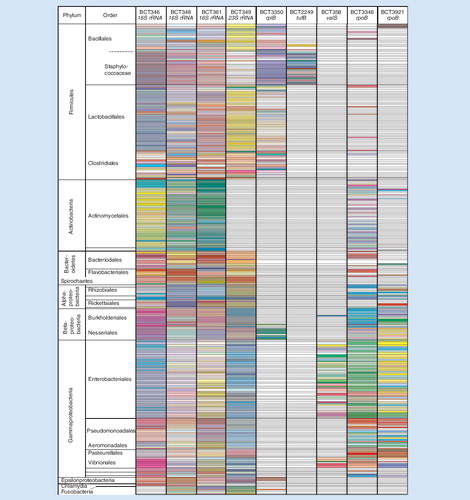
The primer coverage of the rDNA is represented by the gray background. Exceptions are indicated by red boxes.
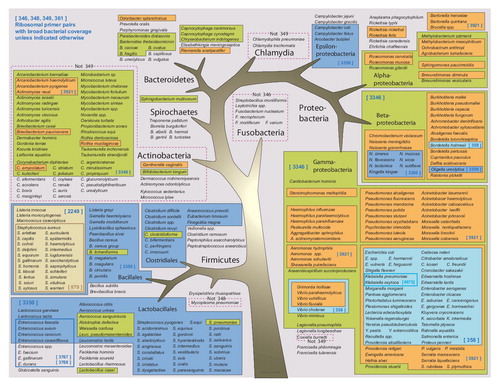
Figure 3. (A) Base composition signatures of Candida spp. Columns correspond to the three chromosomal targets and the mitochondrial rDNA target. AGCT counts for each target are shown in the boxes. (B) Color coding. To create this visualization, base compositions from each primer pair (A, G, C, T) were first mapped into a 3D space according to their relative proportions of G+C, A+C and A+G. This enabled the comparison of base compositions representing amplicons of different lengths, while reducing to three the number of independent axes. For each axis, one end is in turn associated with a primary color; thus, pure hues of cyan, magenta and yellow are associated with the maximum values of G+C, A+C and A+G, respectively. Conversely, the complementary colors are found on the other end of these axes, so pure hues of red, green, and blue are associated with the minimum values of G+C, A+C and A+G, respectively (or equivalently, with the maximum values of A+T, G+T and C+T, respectively). In between, the median values are associated with white on each one of the three axes. Individual color components can thus be extrapolated for each cell, blending the amounts of cyan/white/red, magenta/white/green and yellow/white/blue that correspond to the cell’s G+C, A+C and A+G metrics, respectively. Black ink was added for base compositions representing amplicons whose lengths differ from the consensus length at that particular locus. The process is repeated for each one of the nine loci independently and colors cannot be compared from column to column.
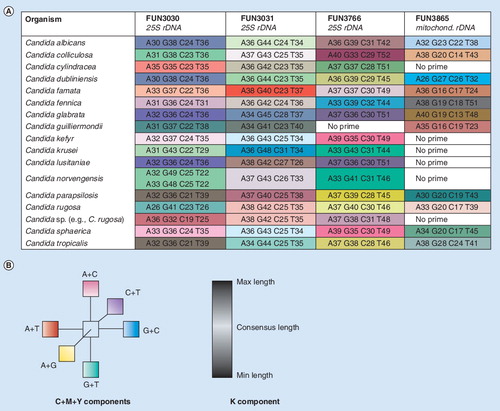
Colored cells represent individual base-composition signatures found for the 332 organisms tested (rows) in the nine loci (columns) that were used for broad bacterial identification. Row height occasionally varies as two or three distinct base counts may be found within the same locus for some organisms. Cells are left blank when no signature was found for the corresponding organism and locus.
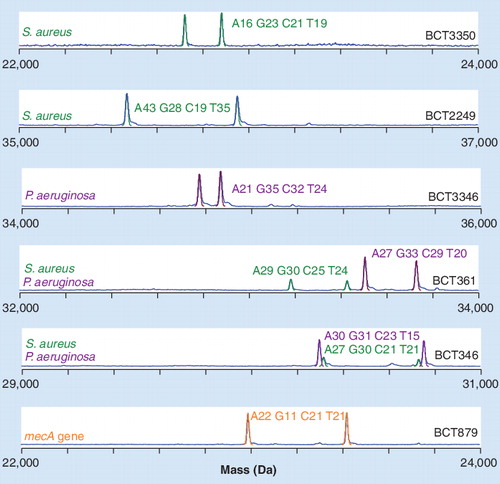
A blood specimen from a patient co-infected with Staphylococcus aureus containing a mecA gene and Pseudomonas aeruginosa as analyzed by PCR/electrospray ionization/mass spectrometry. Individual spectra from six of the nine bacteria-targeted amplifications are shown. M/Z was converted to the M domain and the scales were selected to visualize all detected peaks.
CoNS: Coagulase-negative staphylococci.
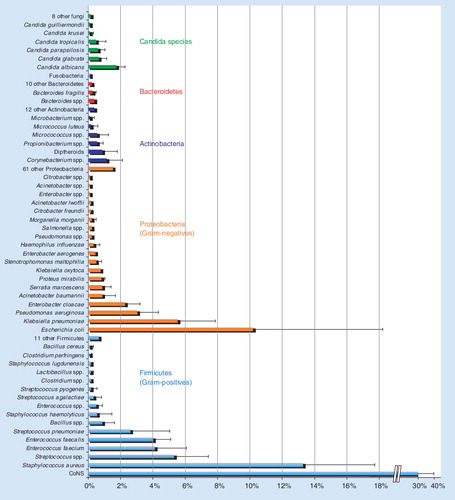
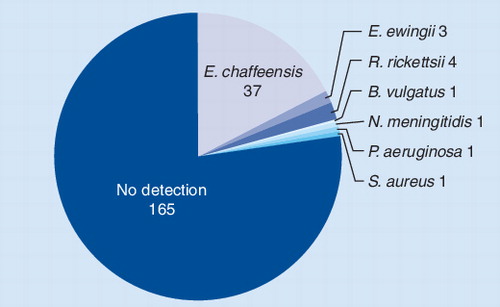
Pie chart showing the distribution of pathogens detected by PCR/ESI-MS from patients with suspected tick-borne infections. Of the 213 specimens tested, 40 (18.8%) tested positive for Ehrlichia chaffeensis or Ehrlichia ewingii.