Figures & data
Relative expression of fusion transcript FUSDDIT3 in 88 single myxoid/round cell liposarcoma cells (A). Distribution of FUSDDIT3 in linear (B) and log10(C) scales.
Data taken from [Ståhlberg A et al., Unpublished Data].
![Figure 2. Single-cell gene-expression data.Relative expression of fusion transcript FUSDDIT3 in 88 single myxoid/round cell liposarcoma cells (A). Distribution of FUSDDIT3 in linear (B) and log10(C) scales.Data taken from [Ståhlberg A et al., Unpublished Data].](/cms/asset/4315f7fe-c9b2-49c5-bcc7-bfa5566f5519/iero_a_11214423_f0002_b.jpg)
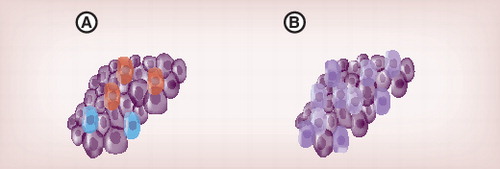
Single-cell analysis allows identification and characterization of different cell types (A) and studies of heterogeneity within respective cell types (B).