Figures & data
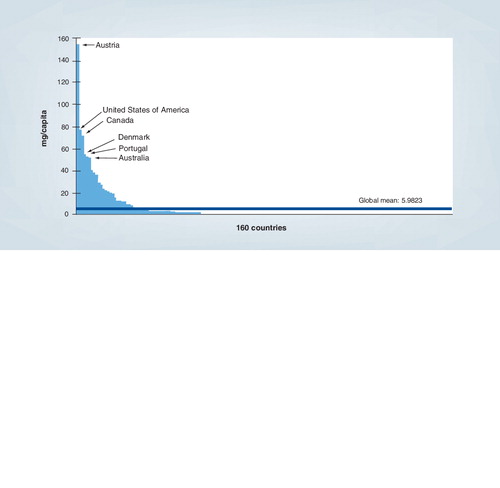
Data taken from International Narcotics Control Board, United Nations Data. Graphic created by the Pain and Policy Study Group, University of Wisconsin/WHO Collaborating Center (2009).
Data taken from Citation[33].
![Figure 2. Opioid-related deaths, 1999–2010 in all categories.Data taken from Citation[33].](/cms/asset/13453148-608c-40f4-a2f7-4ec4f573ee79/iern_a_11213059_f0002_b.jpg)
Adapted with permission from Citation[211].
![Figure 3. Deaths from unintentional drug overdoses in the USA according to major type of drug, 1999–2007.Adapted with permission from Citation[211].](/cms/asset/3551c6df-1fd9-4b39-be92-6d6134dd9a69/iern_a_11213059_f0003_b.jpg)
†Age-adjusted rates per 100,000 population for OPR deaths, crude rates per 10,000 population for OPR abuse treatment admissions and crude rates per 10,000 population for kilograms of OPR sold.
OPR: Opioid pain reliever.
Adapted with permission from Citation[33].
![Figure 4. Rates† of opioid pain reliever overdose deaths, opioid pain relief treatment admissions and kilograms of opioid pain relievers sold – USA, 1999–2010.†Age-adjusted rates per 100,000 population for OPR deaths, crude rates per 10,000 population for OPR abuse treatment admissions and crude rates per 10,000 population for kilograms of OPR sold.OPR: Opioid pain reliever.Adapted with permission from Citation[33].](/cms/asset/d127b393-3d6b-4349-9551-9b9571d34773/iern_a_11213059_f0004_b.jpg)
Adapted with permission from Citation[218].
![Figure 5. Annual societal costs of opioid abuse, dependence and misuse in the USA, 2007.Adapted with permission from Citation[218].](/cms/asset/b42ee8ae-c421-42da-8b80-88d5a512f05c/iern_a_11213059_f0005_b.jpg)
Adapted with permission from Citation[41].
![Figure 6. Percentage of patients and prescription drug overdoses, by risk group in the USA.Adapted with permission from Citation[41].](/cms/asset/ce97a697-99a1-4e0c-87ce-dd12b679b735/iern_a_11213059_f0006_b.jpg)
CT: Computed tomography.
Adapted with permission from Citation[5].
![Figure 7. Guidance to opioid therapy.CT: Computed tomography.Adapted with permission from Citation[5].](/cms/asset/4d112721-03c1-45e5-9ef7-b43f6fecc5a5/iern_a_11213059_f0007_b.jpg)