Figures & data
Reproduced with permission from Citation[47].
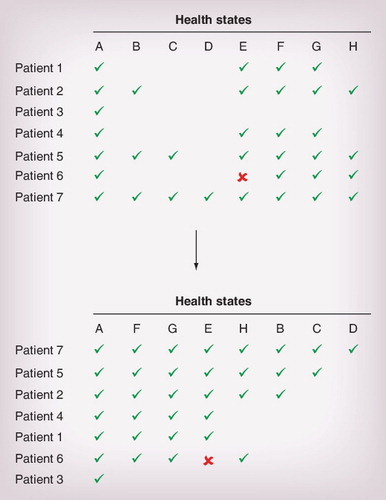
![Figure 3. Deriving paired comparison data based on rank data.Reproduced with permission from Citation[47].](/cms/asset/0bf8ae91-9119-4cab-942b-788fb6d23542/ierp_a_11215612_f0003_b.jpg)
Reproduced with permission from Citation[47].
Please note: Selecting permissions does not provide access to the full text of the article, please see our help page How do I view content?
To request a reprint or corporate permissions for this article, please click on the relevant link below:
Please note: Selecting permissions does not provide access to the full text of the article, please see our help page How do I view content?
Obtain permissions instantly via Rightslink by clicking on the button below:
If you are unable to obtain permissions via Rightslink, please complete and submit this Permissions form. For more information, please visit our Permissions help page.