Figures & data
FIGURE 1 Map showing the locations of the study site (star) and the other sites (numbered) mentioned in the text: 1. Alert, 2. Hazen Plateau, 3. Agassiz Ice Cap, 4. Fosheim Peninsula, 5. Cape Herschel, 6. Isachsen, Ellef Ringnes Island, 7. Char Lake, Cornwallis Island.
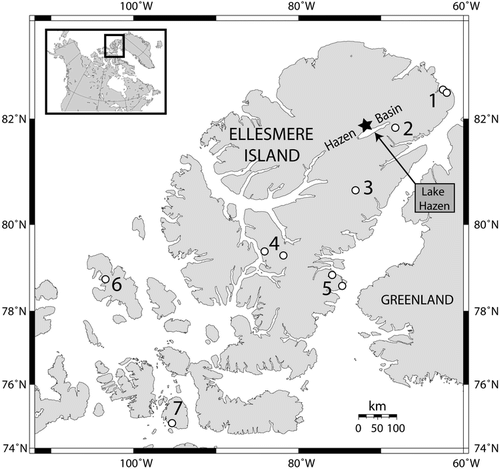
FIGURE 2 Site map detailing the local topography near Skeleton Lake and EP2.
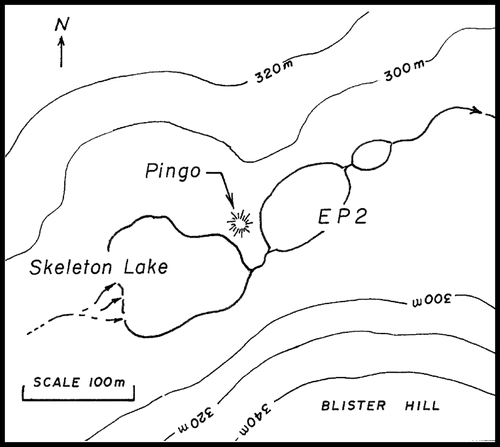
FIGURE 3 Ice-off dates for Skeleton Lake (solid bars) and Lake EP2 (hatched bars). The data from 1963 and 1964 are from CitationOliver and Corbett (1966). The data from 2003 is approximated from our own field observations based on two site visits that occurred seven days apart; during the first visit, EP2 was already ice-free while Skeleton Lake was ∼80% ice-covered. Seven days later, after very warm weather, Skeleton Lake was ice-free.
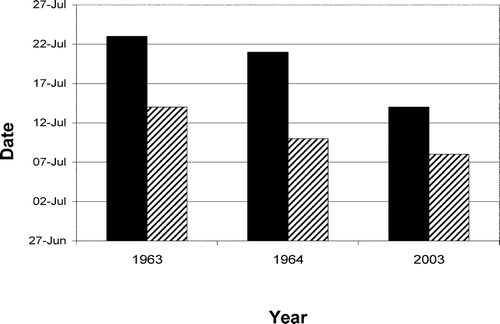
TABLE 1 Selected limnological characteristics for the three study lakes.
FIGURE 4 Principal components analysis (PCA) biplot based on selected measured water chemistry variables that are considered to influence diatom assemblages (pH, specific conductivity, dissolved nutrients, and related variables). The arrows represent the measured environmental variables, while the open circles represent 52 lakes and ponds across northern Ellesmere Island. Skeleton Lake is represented by the solid square, EP2 is represented by the open square, and EP3 is represented by the solid circle. The proximity of these three sites represents their highly similar water chemistry.
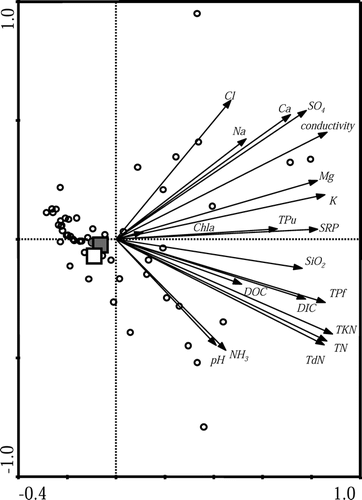
TABLE 2 Diatom taxa (>3% relative abundance) from the top 2.5 cm intervals from the sediment cores of Skeleton Lake and EP2 and the surface sediment (∼2 cm) diatoms from EP3.
FIGURE 5 (A) Age-depth model for Skeleton Lake based on CRS model (CitationBinford, 1990). (B) Total 210Pb activities. The dashed line indicates estimated supported 210Pb.
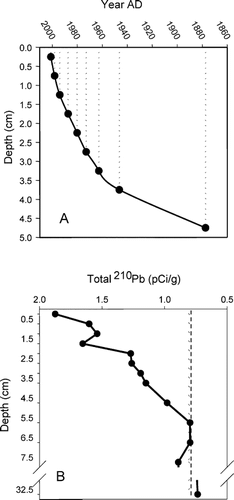
TABLE 3 Common diatom taxa (>3% relative abundance) found in the sediment cores from Skeleton Lake and EP2. Numbers in parentheses after the lake name represent the lengths of the DCA axis 1 gradients, in standard deviation units; N is the number of occurrences, N2 is the effective number of occurrences, calculated according to Hill's N2 (CitationHill, 1973); Max % is the maximum relative abundance. Synonyms for taxa with revised names are listed in the far right column.
FIGURE 6 (A) Diatom profile of Skeleton Lake showing taxa present in at least one interval with a relative abundance of >3%. See for synonyms for some of the common taxa. Percent loss-on-ignition (%LOI; an estimate of organic matter) and PCA axis 2 sample scores (PCA2; a summary of change occurring in rare taxa) are presented at the right side of the profile. (B) Photographs of ice cover on Skeleton Lake and Lake EP2, indicating the physical proximity of the two lakes, Blister Hill, and a nearby pingo for reference (photographs taken 7 July 2003). (C) Diatom profile of EP2 showing only species that are present in at least 3% relative abundance in at least one interval. See for synonyms for some of the common taxa. Percent loss-on-ignition (% LOI), total Pb, and total Hg (both expressed per gram organic carbon), and PCA axis two sample scores (PCA2) are presented at the right side of the profile. The rise in total Pb and Hg are interpreted to mark the onset of anthropogenic pollution (mid-19th to early 20th century).
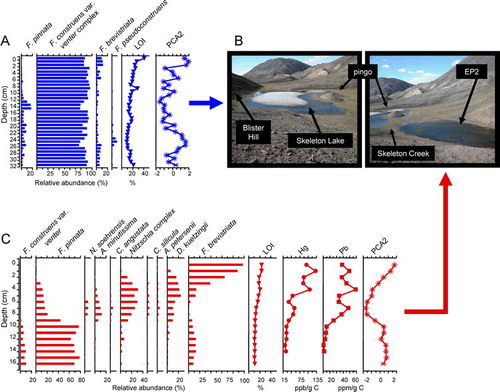
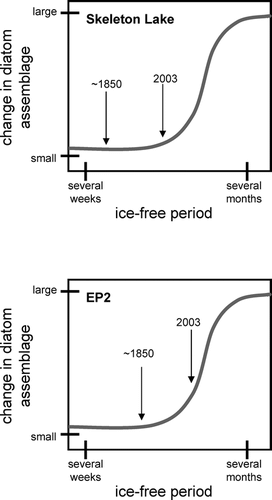
FIGURE 7 Schematic diagrams illustrating possible diatom responses to changing ice cover conditions in the two study lakes. Although the length of the ice-free season has likely increased in both lakes, it has yet to reach a critical threshold in Skeleton Lake, resulting in a muted diatom response. In Lake EP2, reduction in ice cover has crossed this critical threshold and resulted in marked diatom changes.