Figures & data
Figure 1 Map of study site. Inset shows a bathymetric map of Green Lake 4. Location of nutrient enrichment experiments is marked with a black star.
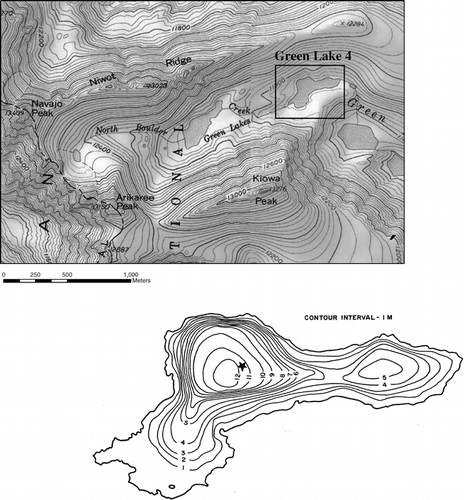
Table 1 Morphometric characteristics of Green Lake 4.
Figure 2 Surface temperature and discharge as a function of time in Green Lake 4. Note that ice out occurred on 9 June. Time periods for incubations 1–4 are indicated by brackets on the x-axis.
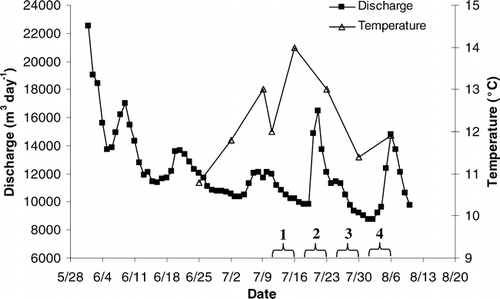
Figure 3 (a) Water temperature and (b) chlorophyll a concentrations with depth and time. Time periods for incubations 1–4 are indicated by brackets on the x-axis.
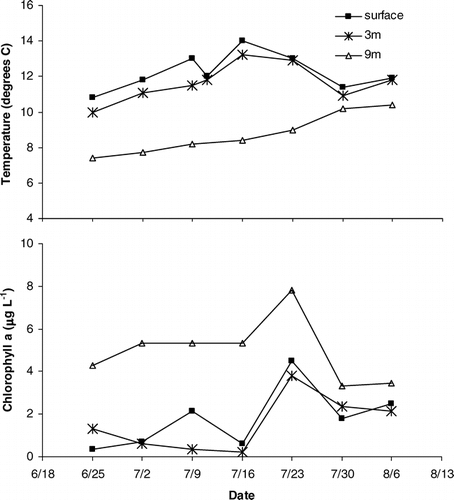
Table 2 Nitrate (NO3 −) and total dissolved phosphorus (TDP) concentrations in the water column of Green Lake 4 (average of 3 depths).
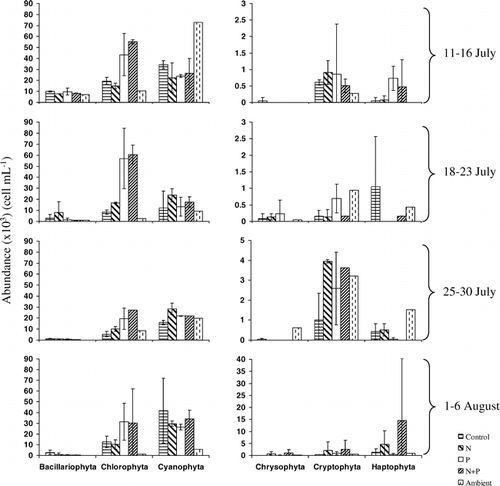
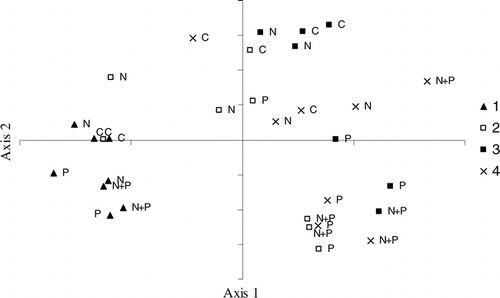
Table 3 Species of algae found in Green Lake 4. The abundance of each taxa found at the end of each incubation as well as the ambient abundance in the epilimnion of the lake is denoted by ‘++++’ for taxa with total cell concentrations greater than 100,000 cells mL−1, taxa with cell concentrations from 10,000 to 100,000 cells mL−1 are indicated by ‘+++,’ taxa with cell concentrations ranging from 1000 to 10,000 are indicated by ‘++,’ taxa with concentrations from 100 to 1000 are denoted by ‘+,’ and rare taxa with concentrations less than 100 cells mL−1 are denoted by a ‘—’ symbol. The incubations are separated by time. Concentrations in replicate incubations were averaged. Given that control incubations were grouped with N-only treatments, and P treatments were grouped with N + P treatments in the PCA output, concentrations in the controls were combined with those in the N-only treatments and concentrations in the P-only treatments were combined with those in the N + P treatments. The PCA weightings for each taxa are also shown.
Table 4 Nitrate (NO3 −) and total dissolved phosphorus (TDP) concentrations for background (water column), control group, and three treatment groups. Background concentrations are an average of three depths and were taken at the end of the date range listed. Incubation concentrations are an average of two replicates and are displayed here as concentrations at the beginning of the incubation, with percent change over the 5-day period in parentheses. A positive percent change indicates release by the plankton community, and a negative percent change indicates uptake by the plankton community.
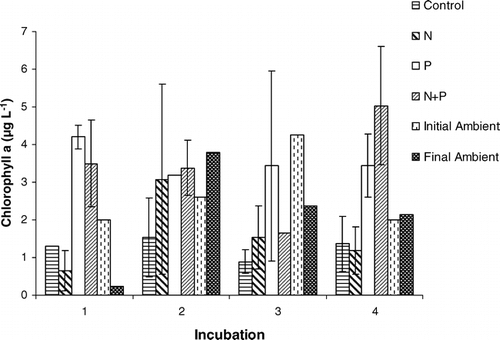
Figure 4 Average chlorophyll a concentrations of duplicates (± two standard deviations) at the end of 5 day incubations in each treatment group for four incubations performed in Green Lake 4 during the summer of 2002. Enrichment incubation samples without error bars (except for the N + P treatment in incubation 3) indicate that there was no discernable difference between the duplicates. Also shown are the in-lake ambient chlorophyll a concentrations measured in the epilimnion at the beginning and end of the incubations.
