Figures & data
TABLE 1 Biomass distribution on Värriö-fell and on Nuortti-fell.
TABLE 2 Species composition on Värriö-fell and on ungrazed and grazed sites of Nuortti, presented as a percentage of covered ground area. If area is less than 0.5%, the number is replaced by +.
FIGURE 1 CCA analysis for study sites. Triangles refer to places as follows: V2 is the Värriö fell, N. graze is the grazed part of Nuortti, and N. ungra is ungrazed part is of Nuortti. Circles in the figure describe species as follows: Vmyrt = Vaccinium myrtillus, Dicran = Dicranum sp¸Vvitisid = Vaccinium vitis-idea, Vulig = Vaccinium uliginosum, Lboreali = Linnaea borealis, Auvaursi = Arctostaphylos uva-ursi, Aalpinus = Arctostaphylos alpinus, Enigrum = Empetrum nigrum, Lground = lichens on ground. The eigen value of first eigenvector explains 8.4% of the species variance and the second eigenvector explains 12.6% of the species variance.
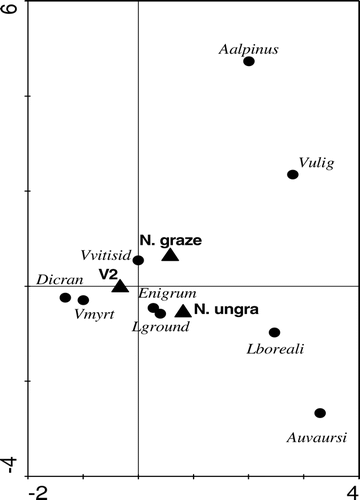
FIGURE 2 Biomass growth on Värriö during growing season 2002 (June describes the situation before growth has begun). Biomass of annuals was less than <0.02 g m−2.
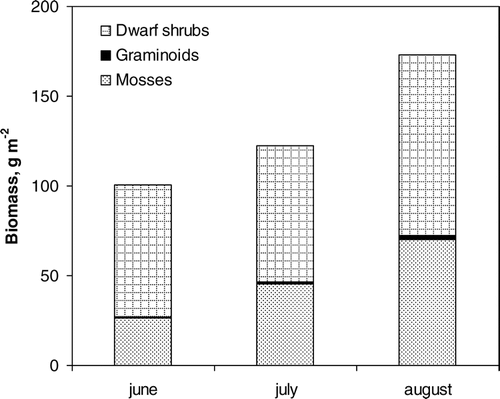
FIGURE 3 Average respiration and net ecosystem exchange in all study sites.
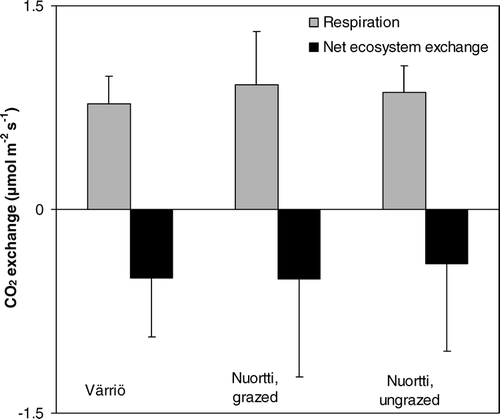
FIGURE 4 (a) Correlation between average net ecosystem exchange (NEE) and dwarf shrub coverage of each cuvette collar. (b) Correlation between average ecosystem respiration and dwarf shrub (%) cover of each cuvette collar. (c) Correlation between average net ecosystem exchange and lichen (%) cover of each cuvette collar. (d) Correlation between average respiration and lichen (%) cover of each cuvette collar. • = Nuortti, grazed (broad dashed line), o = Nuortti, ungrazed (narrow dashed line), and ▴ = Värriö (solid line). The statistical calculations for the images are presented in . The correlations were statistically significant (t-test, p < 0.05) between dwarf shrub coverage and NEE on all sites, between dwarf shrub coverage and respiration on Värriö, and between lichen coverage and respiration on Värriö.
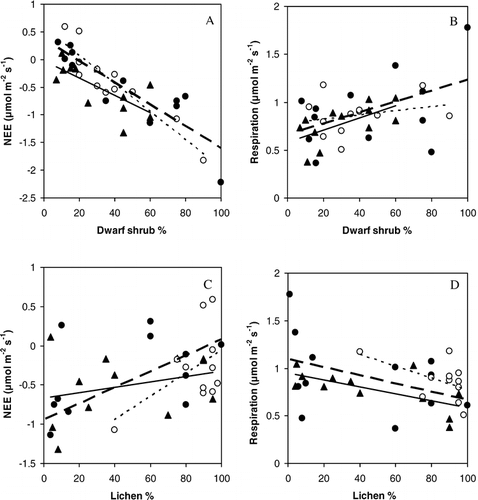
TABLE 3 Relationships between dwarf shrub and lichen cover (X, %) and ecosystem respiration and net ecosystem exchange (NEE) (Y, µmol m−2 s−1) on Nuortti and Värriö using correlation analysis.
FIGURE 5 Average soil temperature, soil moisture, respiration and net ecosystem exchange in (A) Nuortti grazed area, (B) Nuortti ungrazed area, and (C) Värriö fell during each measuring day. Symbols: ▴ (dashed line) = soil temperature (°C), • (solid line) = soil moisture (%), □ (solid line) = net ecosystem exchange (µmol m−2 s−1), and ◊ (dashed line) = respiration (µmol m−2 s−1). There were no statistically significant correlations between carbon exchange and soil moisture or between NEE and soil temperature, but soil temperature had a positive effect on ecosystem respiration (on Värriö R2 = 0.54 and p < 0.02; on Nuortti, ungrazed R2 = 0.51 and p < 0.02; and on Nuortti grazed R2 = 0.36 and p < 0.1). P-values were calculated using the t-test.
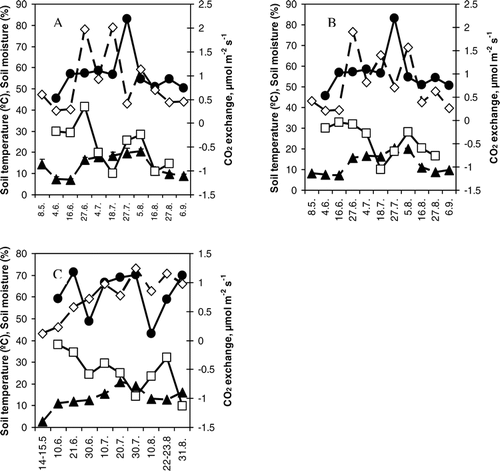
FIGURE 6 Relative change in respiration ratio (Rx) rate during the clipping experiment in grazed (dashed line) and ungrazed (solid line) sites of Nuortti. X-axis stands for days after clipping. BC = before clipping and AC = immediately after clipping. The values are normalized with respect to the values of unclipped plots as described in the materials and methods section.
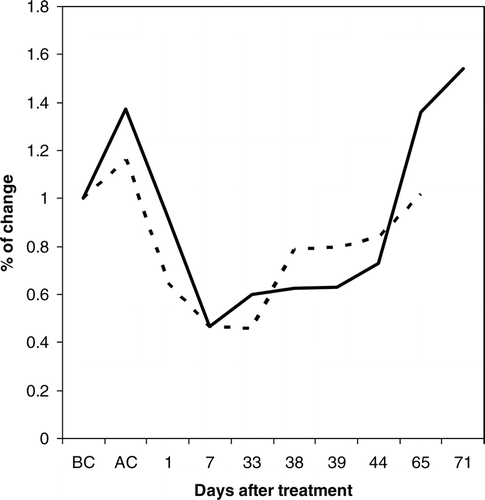
FIGURE 7 Correlation between ecosystem respiration and soil temperature at 2 cm depth on Värriö and Nuortti during growing season of 2004 (June–August). Symbols: ▴ (dashed, wider line) = Värriö (R2 = 0.39), o (dashed line) = Nuortti, ungrazed (R2 = 0.40), and • (solid line) = Nuortti, grazed (R2 = 0.22).
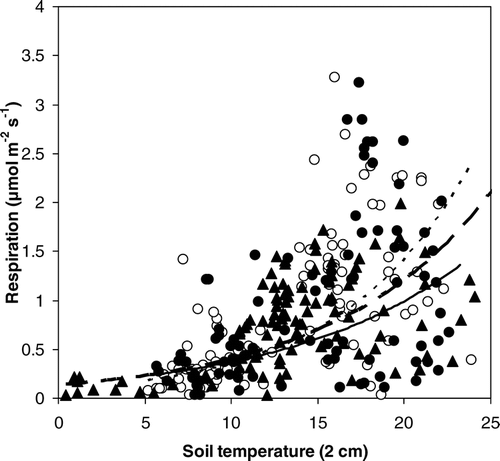
TABLE 4 Parameter values of the parameter a in Q10 formula, Q10 values, average soil temperatures (average of average value in each measurement point) measured from 2 cm depth and their variances. The average temperatures of grazed and ungrazed sites of Nuortti and bare ground and vegetated places of Värriö, respectively, differ statistically from each other using Linear Mixed-Effects Model (at p < 0.001).