Figures & data
FIGURE 1. One of the 27 strip-bark whitebark pines used in the study. The death of the cambium on the right side is complete, while the left side of the tree continues to grow
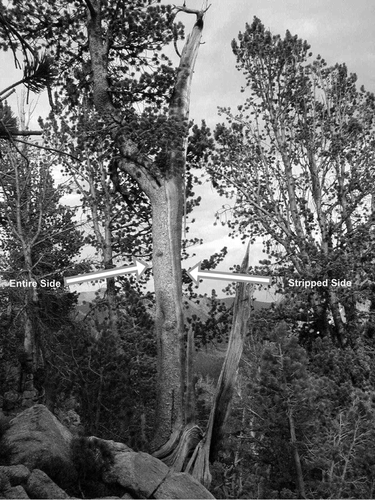
FIGURE 2. Map of the study area in the Tobacco Root Mountains of Montana. Strip-bark tree locations are shown on a 20-m contour map
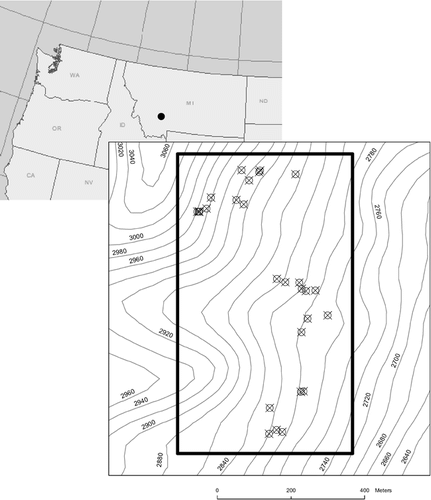
FIGURE 3. The approximate date of the strip-barking event is shown for 15 of the 27 trees used in the study. Although cores were taken from the dead sides of all trees, only the 15 shown were possible to date using dendrochronological methods
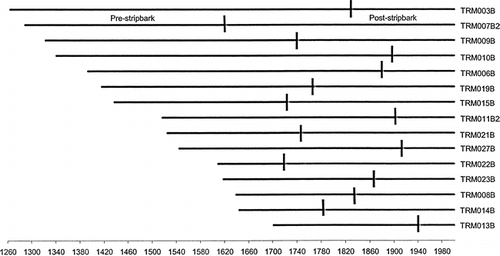
FIGURE 4. Time-series plot of the mean growth increment (in mm) for the 15 datable strip-bark trees and their entire-bark companions
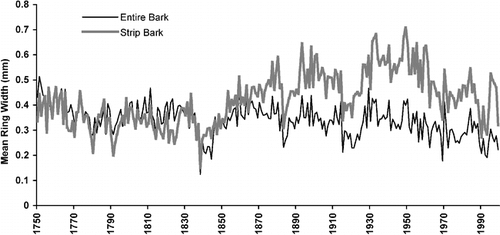
FIGURE 5. Box and whisker plots of the mean yearly growth of the 15 strip-bark trees and their entire-bark trees companions from 1750 to 1874 and from 1875 to 1999 A.D. The strip-bark and entire-bark chronologies were significantly different for the latter period only
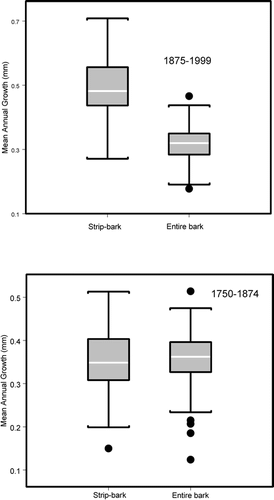
FIGURE 6. Plot of L̂ values marked as triangles at a given distance in meters. The lines are simulation envelopes that are the result of 1000 Monte Carlo simulations
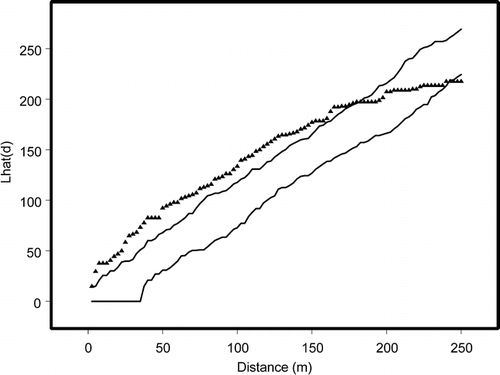
FIGURE 7. Results from Mantel's test for presence/absence data presented as a path diagram. Arrows indicate a significant effect. Magnitude of arrow represents strength of Mantel coefficient. The arrows to the left of the ecological variables indicate simple correlations, while the arrows to the right indicate partial correlations (compare to )
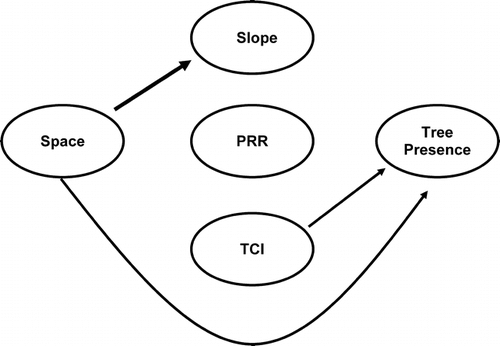
FIGURE 8. Results from Mantel's test for growth data presented as a path diagram. Arrows indicate a significant effect. Magnitude of arrow represents strength of Mantel coefficient. The arrows to the left of the ecological variables indicate simple correlations, while the arrows to the right indicate partial correlations (compare to )
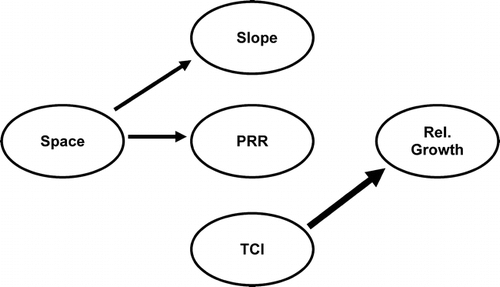
Table 1 Results of simple and partial Mantel's tests for presence of strip-barked trees.a TCI was the most important variable once spatial autocorrelation was taken into account (n = 54)
Table 2 Results of simple and partial Mantel's tests for relative growth rates of strip-barked trees.a Again, TCI was the most important variable once autocorrelation was taken into account (n = 15)