Figures & data
FIGURE 1. Location of Tyndall Glacier in the Southern Patagonia Icefield (SPI) and map of the glacier showing the sampling sites (S1–S10)
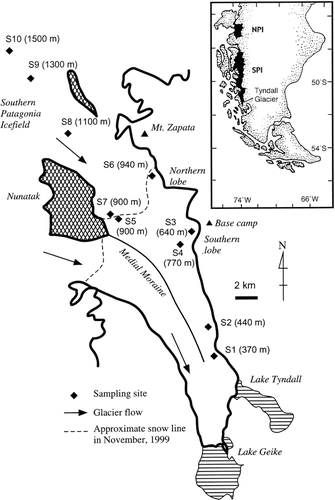
FIGURE 2. Pictures of the snow algae observed on Tyndall Glacier: (a) Mesotaenium berggrenii, (b) unknown algae, (c) Chloromonas sp., (d) Ancylonema sp., (e) Cylindrocystis brébissonii, (f) Oscillatoriaceae cyanobacterium, (g) Closterium sp. All pictures were taken with a normal optical microscope. All samples were fixed with Lugol's solution before being photographed
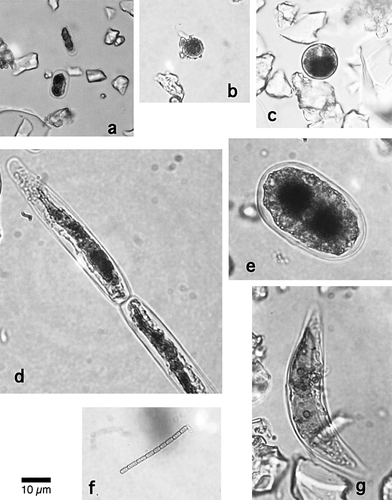
FIGURE 3. Variation of the cell number concentration (cells mL−1) of each snow alga among the collection sites on Tyndall Glacier. The numbers in brackets show the altitude of each site (m a.s.l)
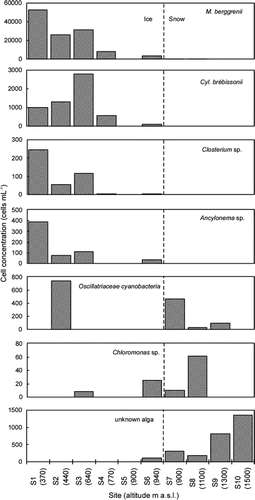
FIGURE 4. Variation of the total cell volume biomass among the collection sites on Tyndall Glacier (1200–1800 m). Error bar = standard deviation. The numbers in brackets show the altitude of each site (m a.s.l.). The data of S5 is out of range (0.000014). The lack of data for S8–S10 is due to sampling procedure (sampled area was not measured)
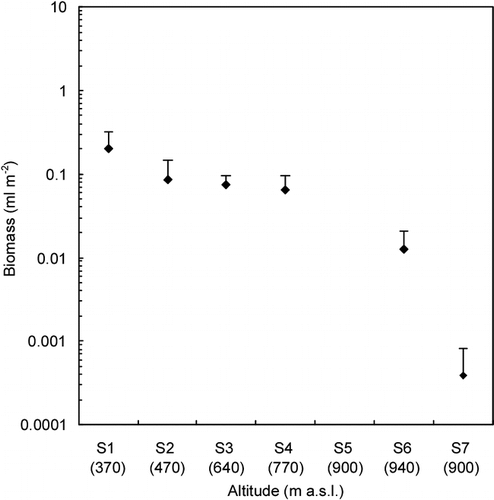
FIGURE 5. Variation of the community structure of snow algae among the collection sites on Tyndall Glacier (proportion of cell volume biomass). Error bar = standard deviation. The numbers in brackets show the altitude of each site (m a.s.l.). The lack of error bar for S8–S10 is due to sampling number (only 1 sample was available)
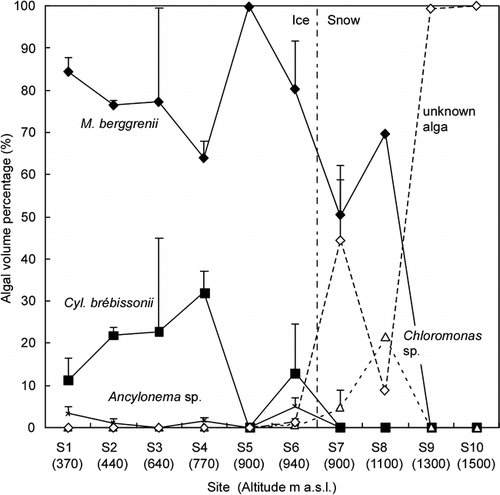
FIGURE 6. Variation of Simpson's diversity index of the snow algal community among the collection sites on Tyndall Glaicer. Error bar = standard deviation. The numbers in brackets show the altitude of each site (m a.s.l.). The lack of error bar for S8–S10 is due to sampling number (only 1 sample was available)
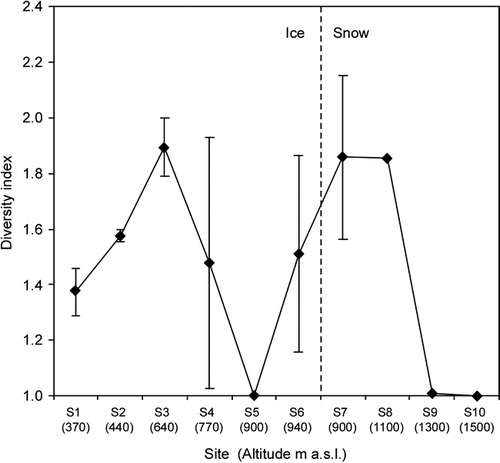
FIGURE 7. Comparison of algal community on the ice area between Patagonian, Alaskan, and Himalayan glaciers: (a) total cell volume biomass, (b) diversity index. Solid marks indicate data of separate sites for each glacier. Open marks indicate mean of the data for each glacier
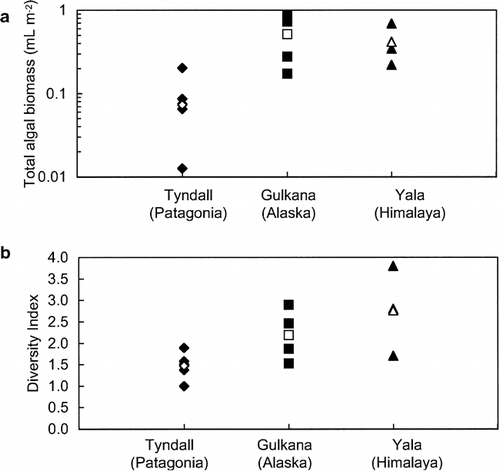
Table 1 Comparison of chemical conditions related to algal growth between Patagonian, Alaskan, and Himalayan glaciers. (EC = electrical conductivity)