Figures & data
FIGURE 1. The Cordillera Blanca in northern Perú. Gray shadings refer to ice extent in 1970 with names of the 12 mountain groups. Quebrada Honda (in italics) divides the northern and southern part. The dashed line documents the coverage of the SPOT satellite scenes. The inlay shows the Cordillera's position in South America
FIGURE 2. The rectified SPOT scenes showing the Cordillera Blanca “ca. 1990.” The boundary between the northern scene (646–368, 22 July 1991) and the southern scene (646–369, 2 June 1987) is shown by the red line. Channel combination: red, XS1; green (3 * XS1 + XS3)/4; blue: XS3
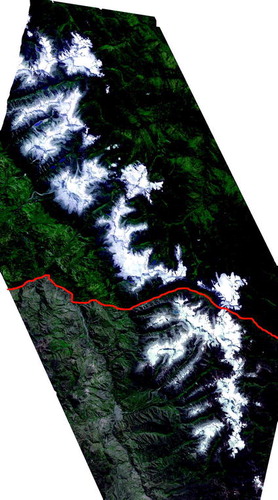
FIGURE 3. Fast development of Laguna Arhueycocha (Cordillera Blanca, Perú): only small ponds exist in 1987 (arrows in SPOT scene, above), whereas the lake fills the whole end moraine in 1995 (Alpenverein map “Cordillera Blanca Nordteil,” scale 1:100,000, below, based on 1995 surveying)
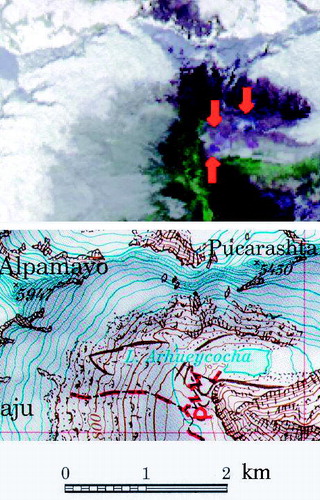
FIGURE 4. Sketch of the glacier fluctuations in the Cordillera Blanca since the end of the Little Ice Age (LIA) maximum according to the presented “ca. 1990” extent, the corrected 1970 value, and the estimation of the 1920s readvance (modified from CitationKaser and Osmaston [2002])
![FIGURE 4. Sketch of the glacier fluctuations in the Cordillera Blanca since the end of the Little Ice Age (LIA) maximum according to the presented “ca. 1990” extent, the corrected 1970 value, and the estimation of the 1920s readvance (modified from CitationKaser and Osmaston [2002])](/cms/asset/01b0066d-b979-4579-aa1a-6d28eea75ce2/uaar_a_11956975_f0010.gif)
Table 1 Covered area, date of scanning, and path/row of the SPOT XS scenes used in this study
Table 2 Glaciated area of the mountain groups in the Cordillera Blanca around 1990. The mountain groups are arranged from north to south. Italics refer to corrected values from Ames et al. (1989). For locations, compare with Figure 1
Table 3 Glaciated area in km2 of the mountain groups in the Cordillera Blanca in 1970 as given in the Glacier Inventory of Perú by Ames et al. (1989) and reevaluated as described in the text. The mountain groups are arranged from north to south
Table 4 Estimates of ice coverage of the Cordillera Blanca mountain groups in the 1930s taken from maps by Borchers (1935a) and Deutscher Alpenverein (1945). Values obtained by aerial photograph analysis refer to Kaser et al. (1996), Georges (1996), and Kaser and Georges (1997). The mountain groups are arranged from north to south
Table 5 Ice extent in the Cordillera Blanca in 1970 and the 1930s compared to the ca. 1990 situation in %. The mountain groups are arranged from north to south
Table 6 Surface ice area in 1930, 1950, 1970, and 1990 in the mountain groups Huascarán and Santa Cruz as given by different authors (values for 1990 refer to this paper)