Figures & data
FIGURE 1. Southern Patagonia Icefield and study area. Figure adapted from CitationAniya et al. (1996) showing main glaciers of the SPI and ice divides. Glaciers flowing to the Pacific Ocean are in light gray. Glaciers contributing to the Atlantic Ocean are in dark gray. Dashed lines show areas where the ice divide is uncertain. Area in rectangle is shown in
FIGURE 2. Landsat ETM+ satellite composite image with bands 1, 4, and 5 from October 2000. Main glacier basins are shown in black. The image is an enlargement of the rectangle shown in
FIGURE 3. ASTER composite (bands 1, 2, and 3 Nadir) satellite image acquired in February 2003, with frontal variations of Glaciares Dickson, Frías, and Cubo. LIA indicates the Little Ice Age moraine estimated by correlation with similar moraines on Lago Grey (CitationMarden and Clapperton, 1995). UTM coordinates are expressed in meters.FIGURE 4. ASTER composite (bands 1, 2, and 3 Nadir) satellite image of 2003 and frontal variations of Glaciares Olvidado, Los Perros, Ohnet, and U-2. UTM coordinates are expressed in meters.FIGURE 5. Landsat ETM+ composite image (bands 1, 4, and 5) of October 2000, with frontal variations of Glaciares Grey, Pingo, and Zapata. UTM coordinates are expressed in meters.FIGURE 6. Landsat ETM+ composite image (bands 1, 4, and 5) of October 2000, with frontal variations of the eastern ice front of Glaciar Tyndall. The control point “Alpha,” the Japanese profile surveyed since 1985 (CitationNaruse et al., 1987) as well as the point measurements carried out by optical survey in 1999 are shown. LIA indicates the Little Ice Age moraine as defined by CitationAniya (1995). UTM coordinates are expressed in meters.FIGURE 7. Landsat ETM+ composite image (bands 1, 4 and 5) with frontal variations of the calving ice fronts of Glaciar Tyndall. UTM coordinates are expressed in meters
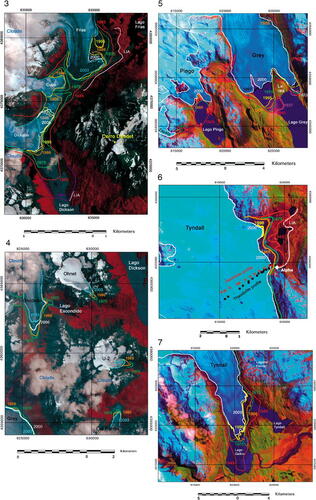
FIGURE 8. Ice elevation changes in meters at the ablation area of Glaciares Frías, Dickson, Olvidado, Cubo, and Grey between 1975 and 1995. UTM coordinates are expressed in meters
TABLE 1 Basic glacier information based on the Landsat ETM+ mosaic acquired in October 2000 and regular cartography of the IGM
TABLE 2 Characteristics of the cartographic data
TABLE 3 Aerial photographs
TABLE 4 Errors for each data set (m)
TABLE 5 Frontal variation (m a−1) of Glaciar Dickson
TABLE 6 Frontal variations (m a−1) of Glaciar Frías
TABLE 7 Frontal variations of glaciares Olvidado, Los Perros, Ohnet and U-2 (m a−1)
TABLE 8 Frontal variations (m a−1) of Glaciar Grey
TABLE 9 Frontal variations (m a−1) of Glaciares Zapata and Pingo
TABLE 10 Frontal variations (m a−1) of Glaciar Tyndall
TABLE 11 Ice area change rates 1945–2000
TABLE 12 Ice elevation change rates 1995–1975 (m a−1)