Figures & data
FIGURE 1. Location of control sites in the Mount Waddington area. In total, 11 control lichen measurement sites were sampled from five different glaciers
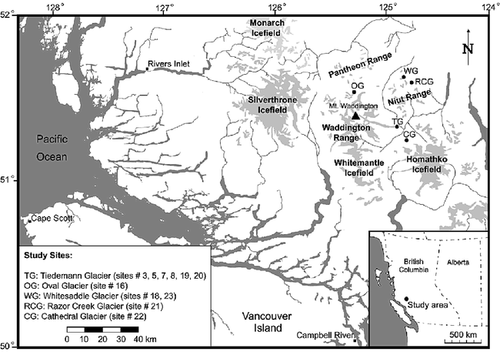
FIGURE 2. Distribution of lichen thalli on control sites. Most of the populations are normally distributed (Shapiro-Wilk normality test), except sites 8 and 19. At these sites, outliers (indicated by an asterisk) were removed from the distribution
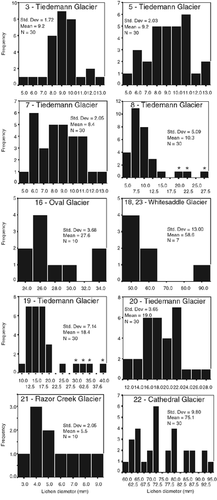
FIGURE 3. Lichen growth curve developed for the Mount Waddington area. A logarithmic relationship explains best the first 100 yr of growth. Between 100 and 680 yr, a linear function describes the growth. The error associated with the curve corresponds to the 95% confidence interval of the logarithmic regression and the 14C calibrated 95% probability
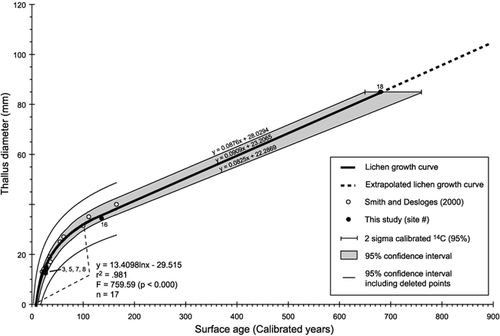
FIGURE 4. Oblique aerial photograph of late-Neoglacial forefield of the Tiedemann Glacier, July 2001
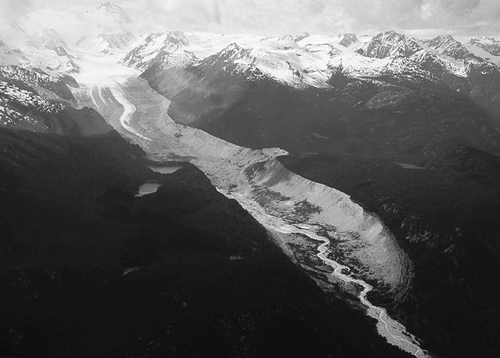
FIGURE 5. Location of lichen measurement transects at Tiedemann Glacier. Lichens were measured along eight transects, for a total of 24 sampling sites (see ). One radiocarbon date of 1270 ± 140 yr BP was obtained from basal peat outside the outermost Little Ice Age moraine (CitationFulton, 1971)
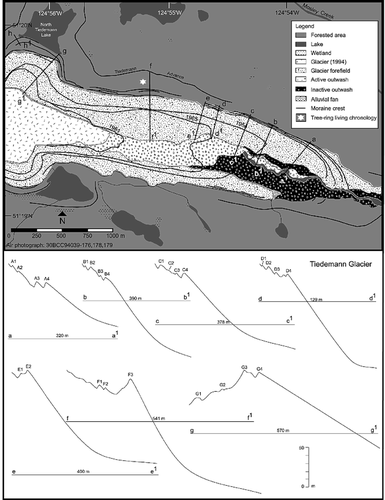
FIGURE 6. Typical lateral moraines at Tiedemann Glacier, showing sparsely distributed trees (whitebark pine, subalpine fir, and Douglas-fir) on four successive bouldery ridges
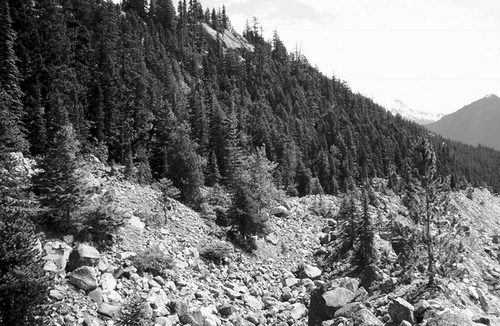
FIGURE 7. Frequency distribution of lichen dates obtained at Tiedemann Glacier. Moraine crests were numbered (capital letters) according to their position on the transects (moraine 1 being the most distal), with moraine numbers from different transects (lower letters) at a site not necessarily being synchronous. Stabilization of lateral moraine, leading to lichen colonization, occurred in six distinct periods: with minimum dates of AD 620 (1), 925 (2), 1118 (3), 1392 (4), 1575 (5), and 1621 (6)
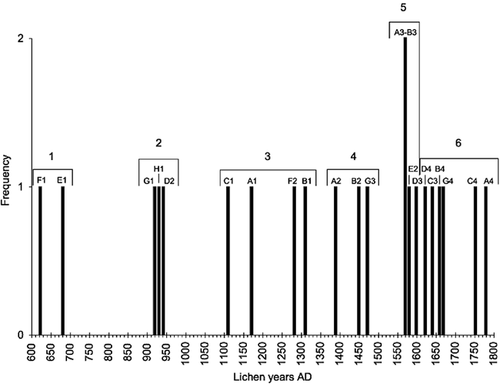
FIGURE 8. Comparative graph of lichen growth curves developed along the Pacific Coast of North America: CitationDenton and Karlén (1973), and CitationWiles et al. (2002) in the Wrangell and St. Elias Mountains of Alaska; CitationSolomina and Calkin (2003) in the Brooks Range, Seward Peninsula, Alaska Range, and Kenai Mountains; CitationLewis (2001) and Larocque and Smith (this study) in the southern B.C. Coast Mountains; CitationPorter (1981) and CitationO'Neal and Schoenenberger (2003) in the Cascade Range of Washington and Oregon
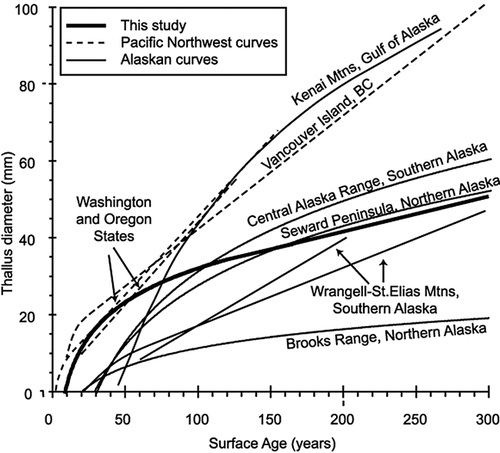
TABLE 1 Lichen species identification (n = 10) (K. A. Glew, 24 February 2002). Eight lichens were identified as Rhizocarpon geographicum (L.) DC. from a variety of lithologies (gneiss, andesite, granite, granodiorite). R. macrosporum Räsänen was found in 2 samples of andesite
TABLE 2 Control points used to develop the Bella Coola/Mount Waddington (BCW) lichen growth curve. Asterisks represent sites not included in the curve
TABLE 3 Statistics of lichen measurements on Mount Waddington control sites. Shapiro-Wilk test was applied on samples n = 30 to assess the normality of the distributions (p ≤ 0.01). Fail tests represent non-normally distributed samples and include outliers that have been removed from the samples to construct the lichen growth curve
TABLE 4 Statistics of lichen measurements at Tiedemann Glacier, and dates derived from the Bella Coola/Mount Waddington (BCW) lichen growth curve. Asterisks indicate samples where an outlier was removed from the distribution
TABLE 5 Rhizocarpon spp. Growth curves developed along the Pacific Coast of North America