Figures & data
FIGURE 1. Snow depth at 2000 m a.s.l. in Switzerland on 1 March 2000 and locations of ski resorts investigated
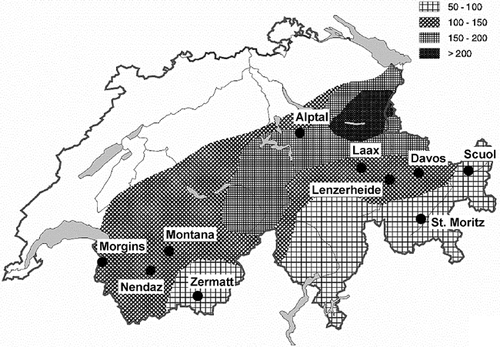
FIGURE 2. Snow depth (A), density (B), and water equivalent (C) in the winter 1999/2000 (mean and standard error of means). The shaded bars indicate the pistes with artificial snow and their off-piste control plots beside the piste; the unshaded bars indicate the pistes with natural snow and their off-piste control plots. Different letters above bars indicate significant differences (P < 0.05) according to Wilcoxon signed-rank tests. The difference between snow depth of piste, artificial snow, and off-piste control is marginally significant, as is the difference between piste, natural snow, and control
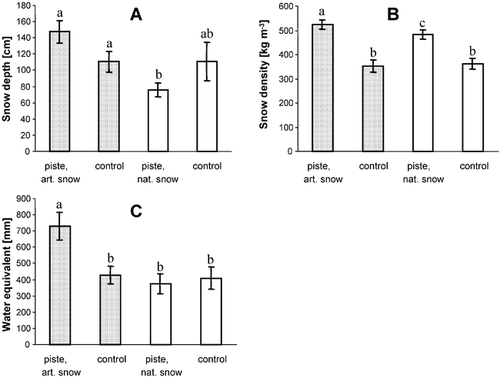
FIGURE 3. Results of the effective conductivity (k) divided by the snow depth difference (ΔZ) mapped on a plot of the snow depth difference (ΔZ) against the snow density (ρ) based on the formula for the effective conductivity k = 0.138 − 1.01ρ + 3.233ρ2 (CitationSturm et al., 1997). The values of k/ΔZ show the relative controls of ΔZ and ρ on the insulation of the snowpack (the higher k/ΔZ the higher the insulation). The large symbols represent the mean values for the given treatments (Artificial snow, piste: 0.34. Off-piste control: 0.17. Natural snow, piste: 0.53. Off-piste control 0.18)
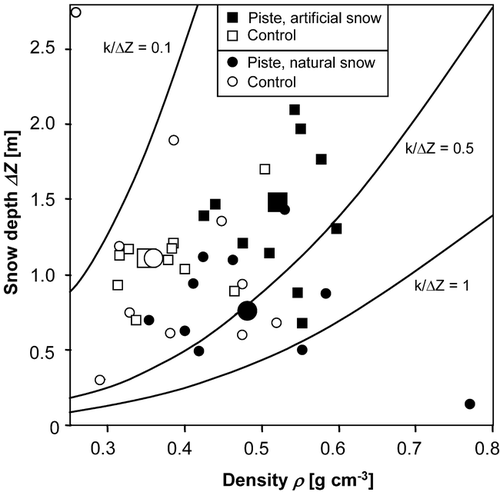
FIGURE 4. Relation between elevation, snow, and ground temperature characteristics in the winter 1999/2000: snow depth (A), snow density (B), water equivalent (C), minimum temperature (D), first snow-free day (E), winter average ground temperature (calculated for snow-covered period for each pair of loggers. Thus positive values are possible e.g. when a logger on an artificial snow piste is covered with snow for a long time while the off-piste control logger is already free of snow and receives solar radiation) (F). Elevation has a highly significant influence on snow density, minimum temperature, first snow-free day, winter average ground temperature and a marginally significant influence on water equivalent (see regression lines)
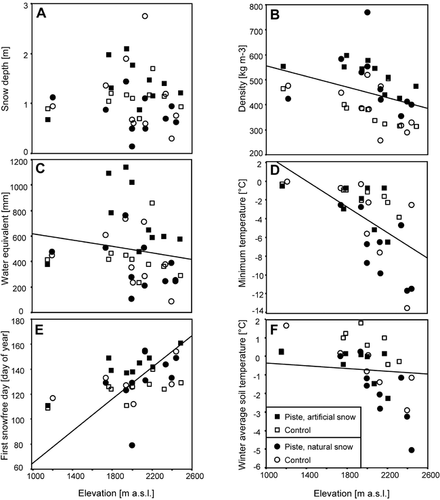
FIGURE 5. Daily mean ground temperatures in the ski resort of Nendaz between November 1999 and May 2000. Nendaz can be considered as representative for average values found in all the resorts (apart from snow disappearing early on piste with natural snow). The onset of snow cover was similar at all plots. Lowest ground temperatures and greatest temperature fluctuations occurred under pistes with natural snow. Beginning of the snowfree season was delayed on pistes with artificial snow
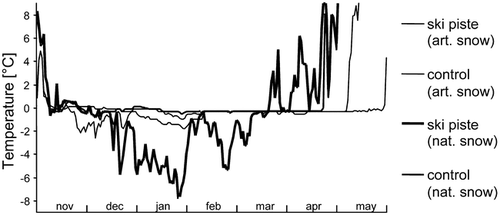
TABLE 1 Study sites. Each ski resort contained four plots: one on a piste with artificial snow plus an off-piste control plot beside the piste and one on a piste with natural snow plus an off-piste control plot. Site characteristics are shown for each pair of plots (piste and off-piste control). Cantons: SZ = Schwyz, GR = Grisons, VS = Valais. AS = artificial snow, NS = natural snow. The potential radiation was calculated after CitationFunk and Hoelzle (1992)
TABLE 2 Analysis of variance for the snow characteristics depth, density and water equivalent. The following sources of variation are included: Elevation = elevation of plots, Resort = ski resort, Type of plot pair = Pair of piste/off-piste control plot (artificial or natural snow), Piste = piste or offpiste. (*): P < 0.1, *: P < 0.05, **: P < 0.01, ***: P < 0.001, df = degrees of freedom, ms = mean squares, F = F-value
TABLE 3 Ground temperature characteristics in the winter 1999/2000 (averages of the ten ski resorts ± standard error of means). Minimum temperature is shown for the snow-covered period. Mean winter ground temperatures are shown (1) calculated for the snow-covered period of each logger separately and (2) calculated for snow-covered period for each pair of loggers (thus positive values are possible, e.g., when a logger on an artificial snow piste is covered with snow for a long time while the off-piste control logger is already free of snow and receives solar radiation)
TABLE 4 Analysis of variance for ground temperature characteristics and first snowfree day in the winters 1999/2000 and 2000/2001 (for sources of variation see ). Mean ground temperatures are values during the snow-covered period from snow formation until snow had disappeared at both of the two loggers of a pair. (*): P < 0.1, *: P < 0.05, **: P < 0.01, ***: P < 0.001