Figures & data
FIGURE 1. Vegetation maps of the shrub tundra (ST), moist nonacidic tundra (MNT) and mossy tussock tundra (MT) 100 × 100 m grids. A vegetation map of the moist acidic tundra (MAT) grid was not developed because the corners of the grid could not be adequately georeferenced from the aerial photographs of the site
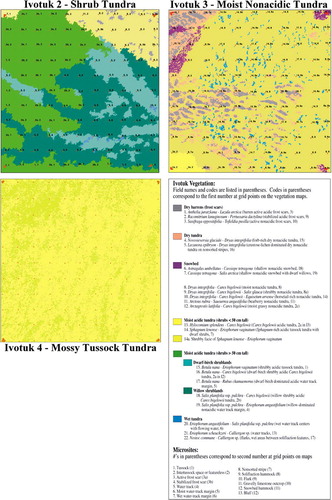
FIGURE 2. (a) Seasonal patterns of NDVI across the 1999 growing season at Ivotuk, Alaska. Curves represent four distinct vegetation types. Error bars represent the standard error of the mean (n = 20); (b) Seasonal patterns of LAI across the 1999 growing season at Ivotuk, Alaska. Curves represent four distinct vegetation types. Error bars represent the standard error of the mean (n = 20); (c) Seasonal patterns of total live above-ground phytomass across the 1999 growing season at Ivotuk, Alaska. Curves represent four distinct vegetation types. Error bars represent the standard error of the mean (n = 10 or n = 20*)
FIGURE 3. (a) Peak quantities of total live above-ground phytomass for the 1999 growing season for four vegetation types found at Ivotuk, Alaska. Distinct hatching represents specific components of above-ground phytomass. (b) The percent of peak live above-ground phytomass comprised by each component plant type for four vegetation types at Ivotuk, Alaska. Distinct hatching represents specific components of above-ground phytomass
TABLE I Soil and topography data for four distinct tundra vegetation types at Ivotuk, Alaska
TABLE 2 Summary of live aboveground phytomass and standing dead quantities for the 1999 growing season for four vegetation types at Ivotuk, Alaska
TABLE 2 (Cont.)
TABLE 3 Estimates of above-ground net primary productivity for four vegetation types at Ivotuk, Alaska
TABLE 4 Spatial coefficients of variation (CV) of mean above-ground live phytomass and standing dead. CVs calculated for mid growing season (15 July–26 July) measurements for four vegetation types at Ivotuk, Alaska