Figures & data
FIGURE 1. Aerial view of Lee Ridge, Glacier National Park, Montana, including locations of fingers in the upper (inset) and lower portions of the ridge. The fingers extend upslope from closed forest, in the direction of the prevailing westerly winds. Photo by D. Cairns, inset by G. Malanson
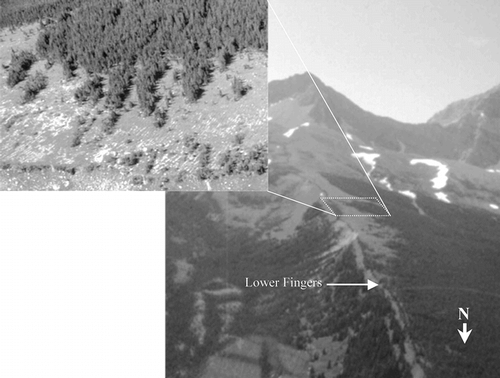
FIGURE 2. Study area, Lee Ridge. The dotted line running through the middle of the park represents the continental divide
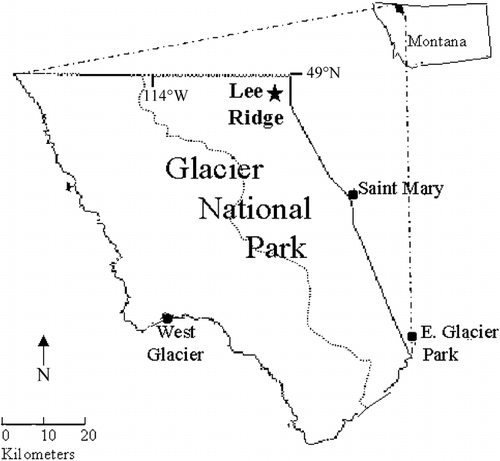
FIGURE 3. Quantile Regression graphs illustrating forest advancement in the five sample transects. Arrows indicate the locations of boulders
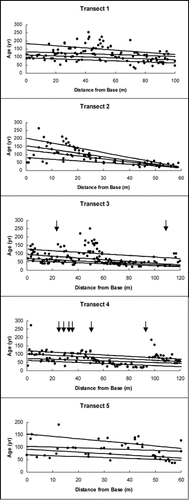
FIGURE 4. Histograms showing establishment of trees in 10-yr age classes for (a) transect 1, (b) transect 2, (c) transect 3, (d) transect 4, (e) transect 5, and (f) all transects
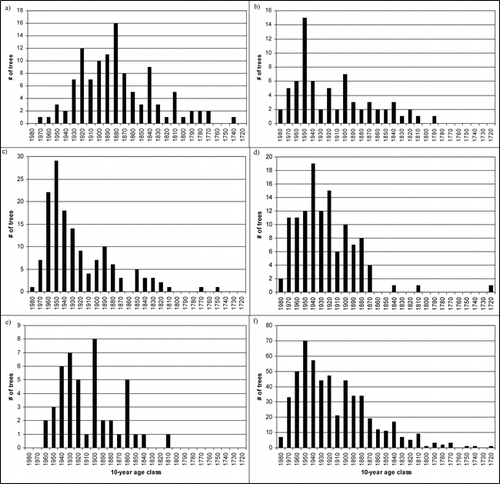
TABLE 1 Characteristics, composition, and structure of the five sample transects, and the entire study site
TABLE 2 Quantile regression statistics for the five sample transects, including selected regression quantiles (τ), estimates of β0 and β1, 95% confidence intervals for β1, and P for H0:β1 = 0 for the model y = β1x + β0, where y = tree age and x = distance from the base of a transect
TABLE 3 Forest advancement rates by transect within 5 m of existing trees (patch scale) and for each transect (transect scale)