Figures & data
FIGURE 1. Shaded relief map of the study area. Reconstructed extent of ice during the Itkillik II glaciation is shown as translucent blue and prominent end moraines are shown as curved lines. Samples for cosmogenic dating are numbered. The first-order ELA trend surface is represented as thin black lines traversing the map with labeled contours
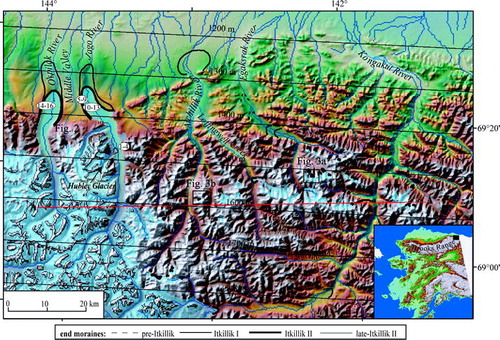
FIGURE 2. Middle Valley, between the Okpilak and Jago River valleys on the north side of the Brooks Range. A series of inset late Pleistocene moraines are tightly nested about 4 km downvalley from the modern glacier. Photo location shown in
FIGURE 3. Contrast in cirque development in adjacent valleys at similar elevations. (A) Egaksrak River valley showing numerous well-developed cirques at elevations reaching 2022 m. (B) Aichillik River valley showing poorly developed cirques at elevations reaching 2030 m. Photo locations shown in
FIGURE 4. 10Be ages of the four moraines dated in the northeastern Brooks Range, arranged from oldest to youngest for each moraine. Ages are not corrected for boulder surface erosion or snow cover, both of which would result in ages ∼10% older (e.g., CitationBriner et al., 2002). The clustering of the ages on the Hubley moraine and Jago River valley left lateral moraine suggests that the average ages closely represent the depositional age of the moraines. In contrast, the wide scatter of ages on the Jago River valley end moraine and the Okpilak River valley moraine hampers the age interpretation of the 10Be analyses
FIGURE 5. Topographic profile across the northeastern Brooks Range (A to A′ in ) showing Itkillik II equilibrium-line altitudes (ELAs), and modern glacier median elevations. Boxes mark the ELAs of the glaciers mapped in the Middle valley (informal name) and the Leffingwell River valley where the moraines can confidently be assigned to the Itkillik II glaciation. Solid line shows the least-squares linear regression of ELAs
TABLE 1 Summary of relative-weathering data from Pleistocene deposits in the northeastern Brooks Range (this study) compared to the northern valleys of the central Brooks (CitationHamilton, 1994)
TABLE 2 10Be age information for moraine boulders of the northeastern Brooks Range
TABLE 3 Average equilibrium-line altitudes (ELAs) for glaciers of the Itkillik II glaciation