Figures & data
FIGURE 1. Study area (modified after http://www.swisstopo.ch/de/digital/over.htm) and location of the study sites (Upper Engadine, Central Alps, Switzerland). Reproduced with permission of swisstopo (BA056881)
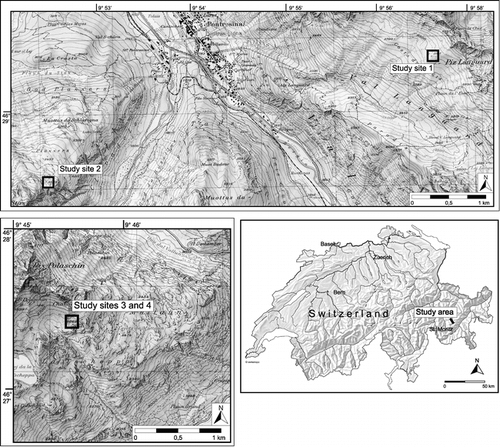
FIGURE 2. Study site 1
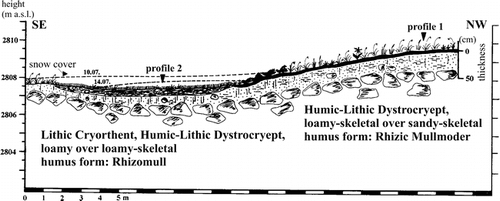
FIGURE 3. Study site 2
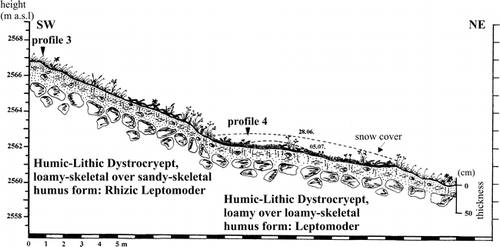
FIGURE 4. Soil texture, pH value (measured in 0.01 M CaCl2 dilution), organic matter content, and Fed and Feo content of profile 1
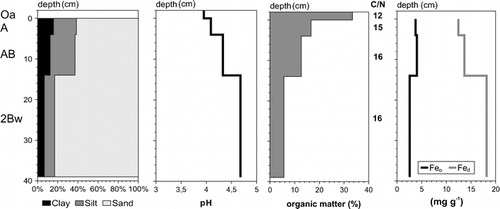
FIGURE 5. Soil texture, pH value (measured in 0.01 M CaCl2 dilution), organic matter content, and Fed and Feo content of profile 2
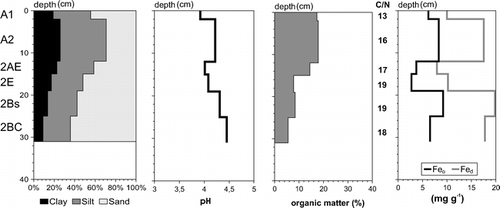
FIGURE 6. Soil texture, pH value (measured in 0.01 M CaCl2 dilution), organic matter content, and Fed and Feo content of profile 3
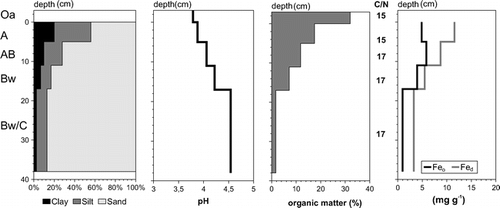
FIGURE 7. Soil texture, pH value (measured in 0.01 M CaCl2 dilution), organic matter content, and Fed and Feo content of profile 4
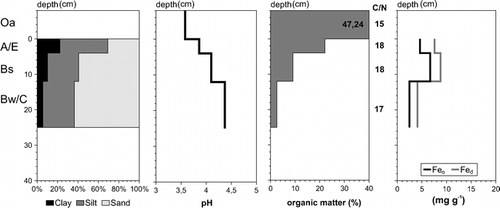
FIGURE 8. Soil texture, pH value (measured in 0.01 M CaCl2 dilution), organic matter content, and Fed and Feo content of profile 5
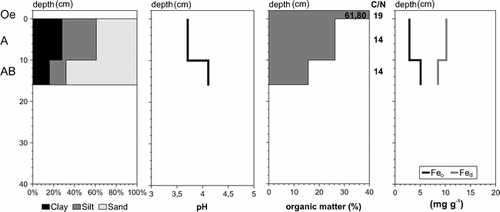
FIGURE 9. Soil texture, pH value (measured in 0.01 M CaCl2 dilution), organic matter content, and Fed and Feo content of profile 6
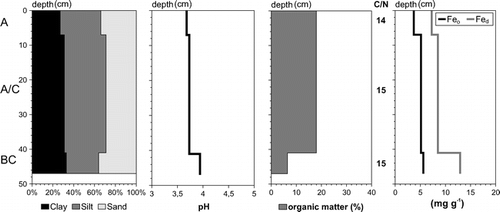
FIGURE 10. Soil texture, pH value (measured in 0.01 M CaCl2 dilution), organic matter content, and Fed and Feo content of profile 7
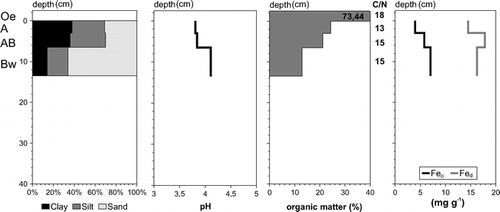
FIGURE 11. Soil texture, pH value (measured in 0.01 M CaCl2 dilution), organic matter content, and Fed and Feo content of profile 8
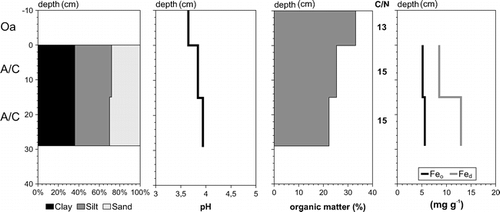
TABLE 1 Classification of the soil profiles 1 to 8
TABLE 2 Site and profile description of study site 1
TABLE 3 Site and profile description of study site 2
TABLE 4 Site and profile description of study site 3
TABLE 5 Site and profile description of study site 4