Figures & data
FIGURE 1. Chlorophyll profiles for three lakes in the Beartooth Mountains situated along an elevational gradient: Kersey, 2690 m a.s.l.; Beartooth, 2967 m a.s.l.; and Fossil, 3300 m a.s.l. The 1% PAR attenuation depth is indicated with corresponding dashed lines for each lake. Lakes were profiled during July 2001, which was within four weeks after ice-off for all lakes. The depth of the chlorophyll maximum increases with elevation and is situated above the limit of the euphotic zone in each case
FIGURE 2. Chlorophyll and nitrate profiles in Island Lake during three weeks in late June to early July 2002, with temperature (°C) isolines indicated. Temperatures below the 6°C isoline were between 4 and 6°C. Chlorophyll values were measured in vivo with a fluorometer and are reported as relative fluorescence units (r.f.u.). Nitrate values are in μM, with values below the detection limit of 0.01 μM reported as zero
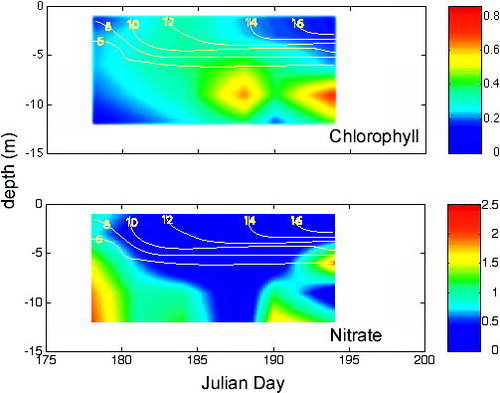
FIGURE 3. Principal components analysis to explore the relationship between the chlorophyll rank of samples and the measured environmental variables. Positions of the samples on the biplot are indicated by circles, with larger circles indicating a higher chlorophyll rank in that sample (i.e., the highest chlorophyll concentration for that profile). The conductivity vector is denoted as SpC; the dissolved nutrient vectors are dN, dP, and dSi
FIGURE 4. Total phytoplankton biovolume measurements (with standard error estimates indicated) from the field experiment in which nutrients and UV exposure were manipulated in a factorial design. The UV treatments consisted of +UV or −UV and are indicated in the legend. Nutrient treatments are indicated on the x-axes, with the control representing no nutrient additions
TABLE 1 Characteristics of the four study lakes, along with measured parameters and their ranges during the study period. Seston nutrient ratios are on a molar basis
TABLE 2 Optical properties of the four lakes, with 1% depths for 320 nm, 380 nm, and PAR determined from Kd values (z1% = 4.6/Kd). These values were measured in July 2001 (unless otherwise noted), while DOC was measured in samples collected in July 2000
TABLE 3 Correlation coefficients between chlorophyll concentration (measured by extraction and spectrophotometric determination) and various parameters from four lakes in the Beartooth Mountain region, with significant parameters indicated in bold. Spearman's rank correlation coefficient was used when the data had non-normal distributions
TABLE 4 Results of Spearman's rank correlation analyses with a p-value < 0.10 for all samples between (1) chlorophyll rank and various parameters; and (2) temperature and various parameters, to illustrate covariation between temperature and several variables