Figures & data
FIGURE 1. Airborne magnetic total intensity map of northern Finland. The study area is shown by a black rectangle. Norway spruce timberline (solid lines) (taken from CitationSihvo, 2002) is based on 30% crown coverage. Pine timberline (dashed lines) (adopted from CitationJuntunen et al., 2002) is based on the same crown coverage. LG = Lapland Granulite Belt, TB = Tanaelv Belt (CitationMarker, 1985), LGB = Lapland Greenstone Belt, S = Sarmitunturi, P = Pallastunturi
FIGURE 2. Compilation of airborne gamma-ray (potassium window) data and digital elevation model of the study area. Measured sites are at the numbered black dots (see ). Main roads presented as black lines
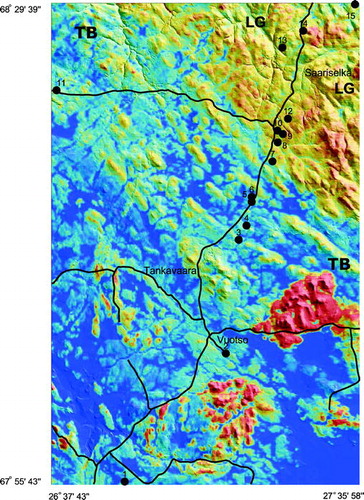
FIGURE 3. Density plot of soil gamma-ray (A), soil dielectric (B), and soil electrical conductivity values (C) for the sites dominated either by Norway spruce or Scots pine in Tanaelv Belt–Lapland Granulite transition in Finnish Lapland
FIGURE 4. Artificial neural network classification for Norway spruce and Scots pine in Tanaelv Belt–Lapland Granulite transition in Finnish Lapland
TABLE 1 Site locations, lithology, tree dominance, elevation, temperature sum, mean soil dielectric values, soil gamma-ray values, and soil electrical conductivity of the study sites