413
Views
6
CrossRef citations to date
0
Altmetric
Contents

Using Environmental Variables to Predict the Structure of Deep-sea Arctic Fish Communities: Implications for Food Web Construction

&
Pages 2-8 | Accepted 01 Sep 2006, Published online: 28 Jan 2018

Figures & data

Figure 1 Map of North Atlantic Fisheries Organization (NAFO) management areas within Baffin Bay and Davis Strait. Data used for analysis were collected from 0A, 1A, 0B, 1C, and 1D between 2000 and 2004. Of the current flows through NAFO management areas within Baffin Bay and Davis Strait, dashed arrows represent warmer waters of the West Greenland Current, solid arrows indicate colder waters of the Polar Current, and dotted arrows represent the moderate Labrador Current.
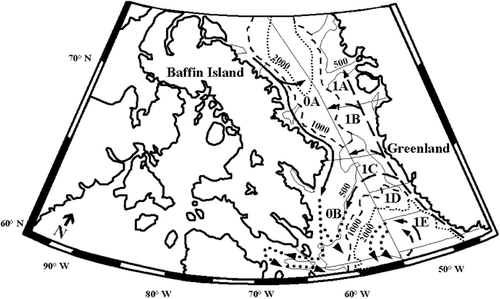
Figure 1 Map of North Atlantic Fisheries Organization (NAFO) management areas within Baffin Bay and Davis Strait. Data used for analysis were collected from 0A, 1A, 0B, 1C, and 1D between 2000 and 2004. Of the current flows through NAFO management areas within Baffin Bay and Davis Strait, dashed arrows represent warmer waters of the West Greenland Current, solid arrows indicate colder waters of the Polar Current, and dotted arrows represent the moderate Labrador Current.

Table 1 List of species found within Davis Strait and Baffin Bay in 2000–2004 surveys.

Table 2 Total redundancy in species that is predicted from variation in the environment, eigenvalues (E), and cumulative proportion of canonical variance (CSE) accounted for by each canonical axis in the redundancy analysis (RDA).

Figure 2 Scatterplot results from redundancy analysis (RDA) of fish abundance and environmental data. Mb: M. berglax; Ar: A. rostrata; Cr: C. rupestris, S. kaupi; Sme: S. mentella; Aa: A. atlanticus, B. saida, L. fabricii; Rah: R. hyperborea; Pb: P. bathybius.
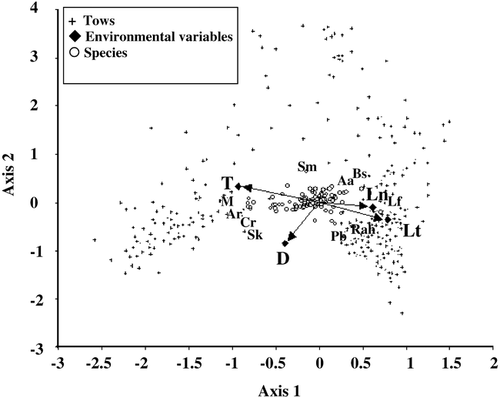
Figure 2 Scatterplot results from redundancy analysis (RDA) of fish abundance and environmental data. Mb: M. berglax; Ar: A. rostrata; Cr: C. rupestris, S. kaupi; Sme: S. mentella; Aa: A. atlanticus, B. saida, L. fabricii; Rah: R. hyperborea; Pb: P. bathybius.

Figure 3 Proportion of 20 most common by-catch species within (a) NAFO subarea 0A and (b) NAFO subarea 0B between 2000 and 2001.
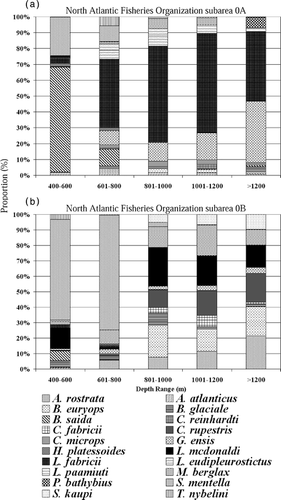
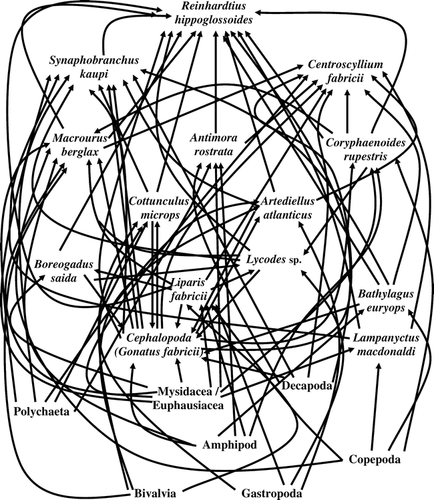
Figure 3 Proportion of 20 most common by-catch species within (a) NAFO subarea 0A and (b) NAFO subarea 0B between 2000 and 2001.
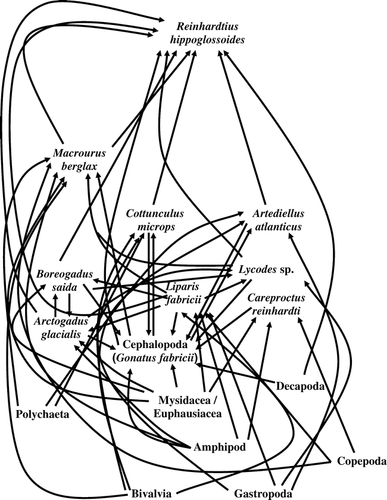
Figure 4 Generalized partial food web of NAFO subarea 0B representing common predator and prey species based on stomach content data from 2000–2001 samples.

Figure 4 Generalized partial food web of NAFO subarea 0B representing common predator and prey species based on stomach content data from 2000–2001 samples.

Figure 5 Generalized partial food web of NAFO subarea 0A representing common predator and prey species based on stomach content data from 2000–2001 samples.

Figure 5 Generalized partial food web of NAFO subarea 0A representing common predator and prey species based on stomach content data from 2000–2001 samples.

Reprints and Corporate Permissions

Please note: Selecting permissions does not provide access to the full text of the article, please see our help page How do I view content?

To request a reprint or corporate permissions for this article, please click on the relevant link below:

Academic Permissions

Please note: Selecting permissions does not provide access to the full text of the article, please see our help page How do I view content?

Obtain permissions instantly via Rightslink by clicking on the button below:

If you are unable to obtain permissions via Rightslink, please complete and submit this Permissions form. For more information, please visit our Permissions help page.