407
Views
23
CrossRef citations to date
0
Altmetric
Contents

Midwinter Snowpack Variation Across the Arctic Treeline, Churchill, Manitoba, Canada

&
Pages 9-15 | Accepted 01 Sep 2006, Published online: 28 Jan 2018

Figures & data

Figure 1 The long-term environmental monitoring sites extended from forested and burned sites 15 km inland from the coast. Biomes separated by dotted lines. Coastal locations were dominated by tundra. Sites sampled: TUN, Tundra; TIS, Forest-Tundra Tree Island; WSU, White Spruce Upland Forest; BSW, Black Spruce Wetland; and BFR, Burned Forest (spruce).
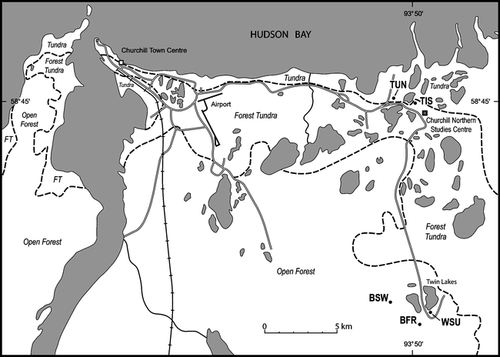
Figure 1 The long-term environmental monitoring sites extended from forested and burned sites 15 km inland from the coast. Biomes separated by dotted lines. Coastal locations were dominated by tundra. Sites sampled: TUN, Tundra; TIS, Forest-Tundra Tree Island; WSU, White Spruce Upland Forest; BSW, Black Spruce Wetland; and BFR, Burned Forest (spruce).

Table 1 Sample sizes and canopy characteristics of the long-term environmental monitoring sites, Churchill, Canada.

Figure 2 Within-site snowpack depth was similar over the three years but differed among sites. Arithmetic mean with error bar cap at one standard deviation and tick for the median. Tundra and Tree Island (Forest-Tundra Tree Island), White Spruce Forest (upland), and Burned Forest (upland). Different letters indicate significant differences (p < 0.001).
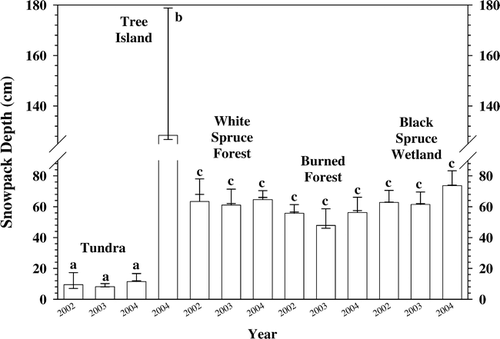
Figure 2 Within-site snowpack depth was similar over the three years but differed among sites. Arithmetic mean with error bar cap at one standard deviation and tick for the median. Tundra and Tree Island (Forest-Tundra Tree Island), White Spruce Forest (upland), and Burned Forest (upland). Different letters indicate significant differences (p < 0.001).

Figure 3 The Tundra site had the greatest within-site variation in snowpack density, and it was significantly higher in the first year. The forest sites and the burned forest had similar snowpack density and they were similar to the tundra in the last two years. Arithmetic mean with error bar cap at one standard deviation and tick for the median value. Different letters indicate significant differences (p < 0.001).
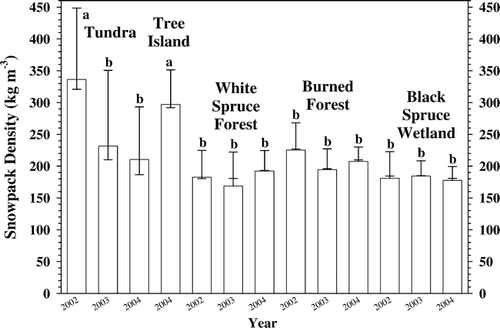
Figure 3 The Tundra site had the greatest within-site variation in snowpack density, and it was significantly higher in the first year. The forest sites and the burned forest had similar snowpack density and they were similar to the tundra in the last two years. Arithmetic mean with error bar cap at one standard deviation and tick for the median value. Different letters indicate significant differences (p < 0.001).
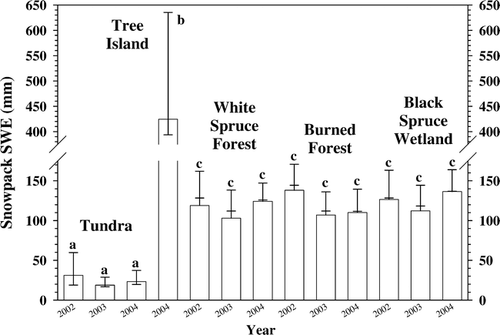
Figure 4 Within-site variation of snow water equivalent (SWE) was greatest at Forest-Tundra Tree Island. The Tundra values were significantly less than all other sites and the forested and burned sites were similar. Between-year variations were not significant. Arithmetic mean with error bar cap at one standard deviation and tick for the median value. Different letters indicate significant differences (p < 0.001).
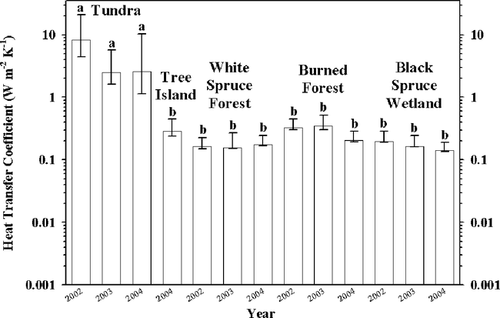
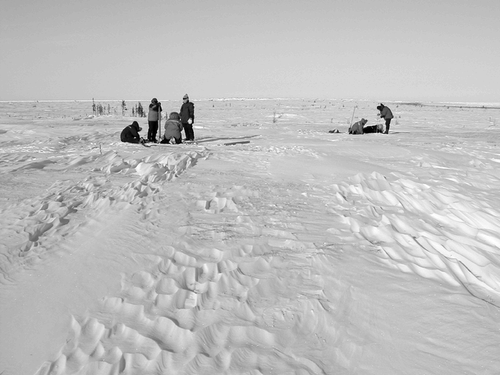
Figure 4 Within-site variation of snow water equivalent (SWE) was greatest at Forest-Tundra Tree Island. The Tundra values were significantly less than all other sites and the forested and burned sites were similar. Between-year variations were not significant. Arithmetic mean with error bar cap at one standard deviation and tick for the median value. Different letters indicate significant differences (p < 0.001).
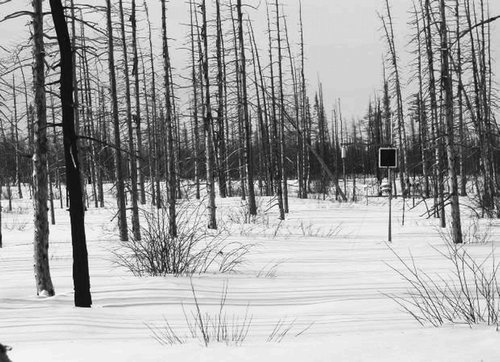
Figure 5 Heat transfer coefficients were at least an order of magnitude higher on the Tundra than at all other sites. Arithmetic mean with error bar cap at one standard deviation and tick for the median value. Different letters indicate significant differences (p < 0.001).

Figure 5 Heat transfer coefficients were at least an order of magnitude higher on the Tundra than at all other sites. Arithmetic mean with error bar cap at one standard deviation and tick for the median value. Different letters indicate significant differences (p < 0.001).

Figure 6 The tundra snowpack was thin to discontinuous with scour and drift throughout the site. Reworking of the snowpack by wind was evident in the zastrugi that was common on the site. Consequently, snowpack characteristics were spatially and internally variable.

Figure 6 The tundra snowpack was thin to discontinuous with scour and drift throughout the site. Reworking of the snowpack by wind was evident in the zastrugi that was common on the site. Consequently, snowpack characteristics were spatially and internally variable.

Figure 7 A wildfire killed all above-ground portions of plants in the Burned Forest in 1997. Resprouting of shrubs has contributed to the lack of wind scour with the result that the snowpack characteristics were similar to the unburned White Spruce (upland) and Black Spruce Wetland forests.

Figure 7 A wildfire killed all above-ground portions of plants in the Burned Forest in 1997. Resprouting of shrubs has contributed to the lack of wind scour with the result that the snowpack characteristics were similar to the unburned White Spruce (upland) and Black Spruce Wetland forests.

Reprints and Corporate Permissions

Please note: Selecting permissions does not provide access to the full text of the article, please see our help page How do I view content?

To request a reprint or corporate permissions for this article, please click on the relevant link below:

Academic Permissions

Please note: Selecting permissions does not provide access to the full text of the article, please see our help page How do I view content?

Obtain permissions instantly via Rightslink by clicking on the button below:

If you are unable to obtain permissions via Rightslink, please complete and submit this Permissions form. For more information, please visit our Permissions help page.