Figures & data
FIGURE 1 Distributions of meteorological stations and typical climate zones in the Qinghai-Tibet Plateau. The star represents Xining (52866; capital of Qinghai Province) and the square represents Lhasa (55591; capital of Tibet Autonomous Region).
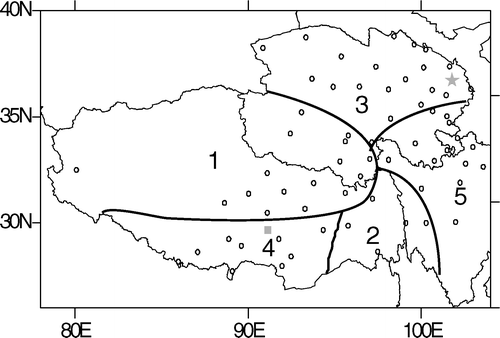
FIGURE 2 Anomalies of area-averaged annual mean temperature (a, in °C) and rates of change in station annual temperature (b, in °C yr−1) over the Qinghai-Tibet Plateau from 1961 to 2007.
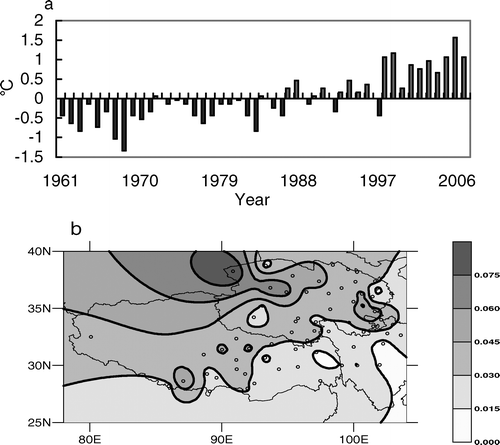
FIGURE 3 Same as in , but for winter (a), spring (b), summer (c), and autumn (d).
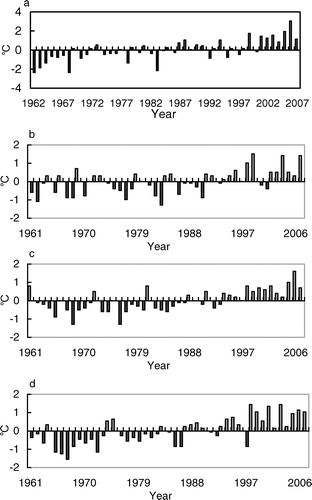
TABLE 1 Averaged rates of changes in mean, maximum, and minimum temperatures over the various climate zones in the Qinghai-Tibet Plateau from 1961 to 2007 (°C yr−1). Results are shown for seasonal and annual means, and values that significantly exceed the 95%, 99%, and 99.9% confidence levels (F-test) are indicated by *, **, and ***, respectively.
FIGURE 4 Anomalies of area-averaged annual mean precipitation (a, in mm) and rates of changes in station annual precipitation (b, mm yr−1) over the Qinghai-Tibet Plateau from 1961 to 2007. The red line on the right encircles the Hequ region.
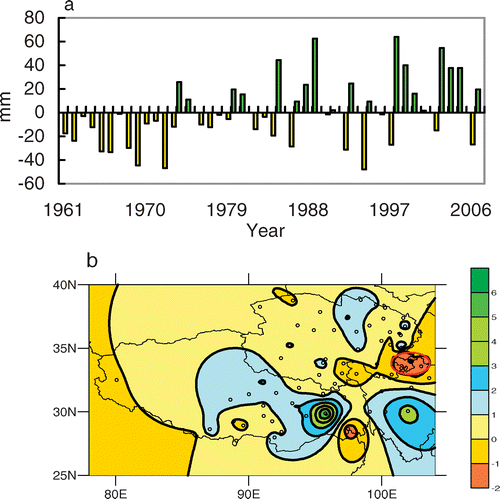
TABLE 2 Averaged rates of changes in precipitation amount (mm yr−1) and number of precipitation days (day yr−1) over the various climate zones in the Qinghai-Tibet Plateau from 1961 to 2007. Results are shown for seasonal and annual means, and values that significantly exceed the 95%, 99%, and 99.9% confidence levels (F-test) are indicated by *, **, and ***, respectively.
FIGURE 5 Changes in cool-warm classes (a) and dry-wet classes (b) over the Qinghai-Tibet Plateau from 1961 to 2007. Upward order of −2, −1, 0, 1, and 2 is set for cool, slightly cool, normal, slightly warm, and warm in (a), and for dry, slightly dry, normal, slightly wet, and wet in (b).
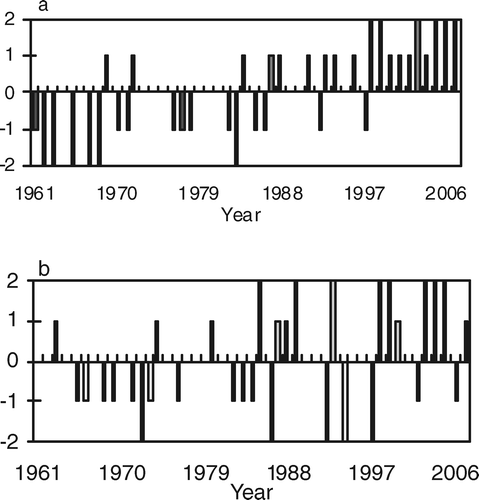
FIGURE 6 Anomalies of the frequencies (in number of occurrence) of extremely high temperature events (a) and extreme heavy rain events (b) over the Qinghai-Tibet Plateau from 1961 to 2007.
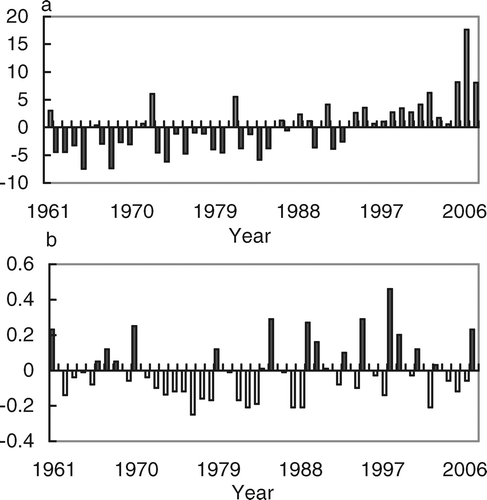
FIGURE 7 Anomalies of the frequencies (in number of occurrence) of extremely low temperature events (a) and severely dry events (b) over the Qinghai-Tibet Plateau from 1961 to 2007.
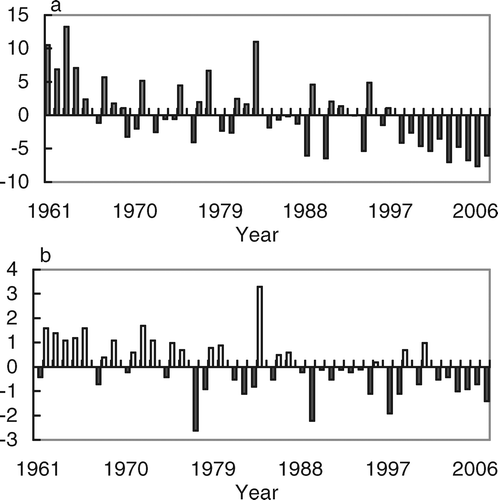
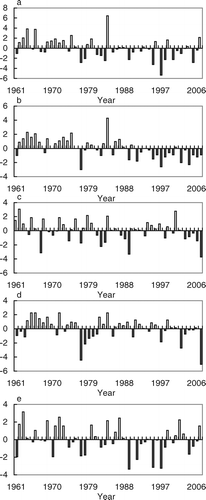
FIGURE 8 Same as in (for extremely low temperature events), but for Zone 1 (a), Zone 2 (b), Zone 3 (c), Zone 4 (d), and Zone 5 (e).
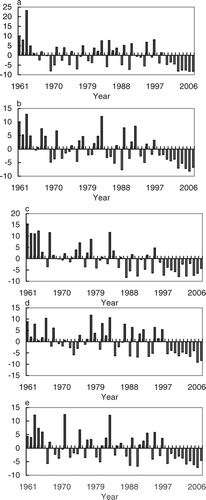
FIGURE 9 Same as in (for severely dry events), but for Zone 1 (a), Zone 2 (b), Zone 3 (c), Zone 4 (d), and Zone 5 (e).