Figures & data
Table 1 Data compiled in previous studies in La Caldera Lake. TP: total phosphorus, DIN: dissolved inorganic nitrogen, TN: total nitrogen, DIN∶TP (mass ratio), Phy: phytoplankton abundance, B: bacterial abundance, HNF: heterotrophic nanoflagellates abundance, Zoo: zooplankton abundance.
Figure 1 Lake thermal response to 24-hour variations in meteorological conditions during the ice-free period in La Caldera (from June to October of 2005 and 2006). Solid line: temperature registered by a thermistor placed at surface, broken line: temperature registered by a thermistor placed at the bottom. p-values corresponding to differences between surface and bottom temperatures are shown for each year.
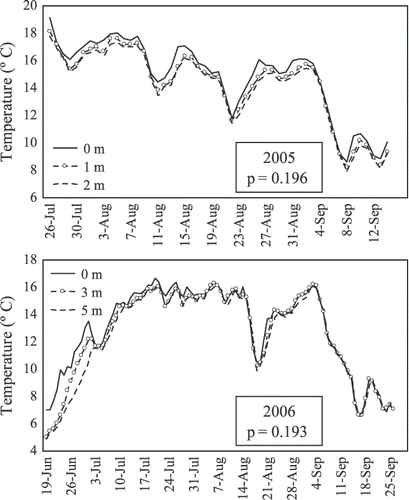
Figure 2 Mean water column concentrations of nutrients. (a) Total phosphorus (TP; µg L−1) and soluble reactive phosphorus (SRP; µg L−1); (b) total nitrogen (TN; mg L−1) and dissolved inorganic nitrogen (DIN; mg L−1); and (c) Nitrogen∶Phosphorus mass ratio in summer of 2005 and 2006. Broken line in (c) indicates zones of nutrient limitation for the DIN∶TP from CitationMorris and Lewis (1988). Above the line, DIN∶TP values indicate P-limitation and below the line indicate N-limitation. Significant differences at p < 0.05 between years are indicated with letters. Error bars represent ± standard deviation (SD) of the mean.
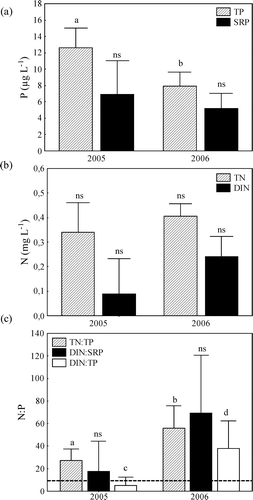
Figure 3 Within-year and year-to-year variations in the abundance (a, c) and biovolume (b, c) of bacteria (abundance: 109 cell mL−1; biovolume: 109 µm3 L−1), phytoplankton (abundance: 107 cell mL−1; biovolume: 109 µm3 L−1), HNF (abundance: 107 cell mL−1; biovolume: 108 µm3 L−1), ciliates (abundance: 103 cell mL−1; biovolume: 108 µm3 L−1), and zooplankton (abundance: ind L−1; biovolume: 108 µm3 L−1) in La Caldera in summers of 2005 and 2006. Significant differences at p < 0.05 between years are indicated with letters. Error bars represent standard deviation (SD).
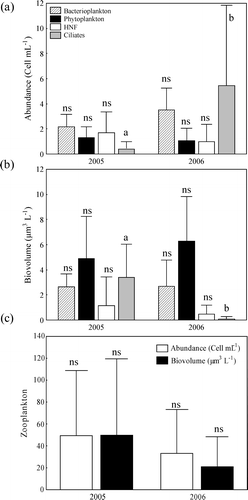
Table 2 Chlorophyll a concentrations (Chl-a, µg L−1) and Autotrophic:Heterotrophic ratio (A∶H).
Figure 4 Inter-annual variability of (a) maximum depth, (b) accumulated annual rainfall of La Caldera, and (c) relationship between maximum depth and accumulated annual rainfall during the last 20 years. Vertical arrows in (a) and (b) indicate the occurrence of severe droughts (1995, 1999, and 2005), and broken lines in (b) indicate the mean values ± standard deviation of annual precipitation of 1985–2006 period. Data of accumulated annual rainfall were obtained from CETURSA Sierra Nevada, S.A. (management company of Sierra Nevada ski resort).
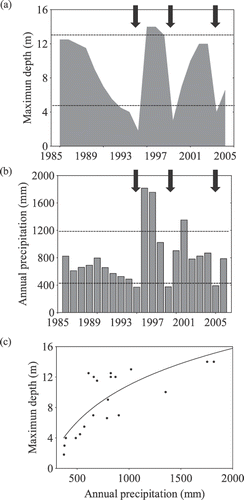
Figure 5 Winter North Atlantic Oscillation (NAO) index for each period. Boxes = standard errors. Whiskers = min.−max.
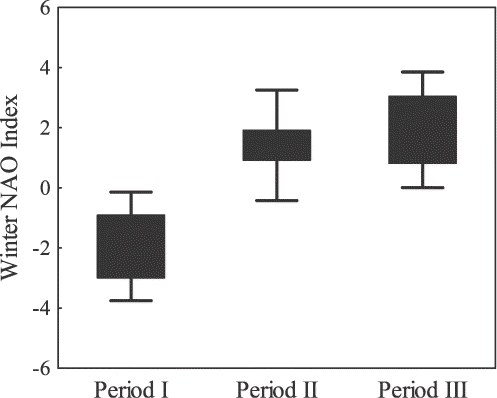
Figure 6 Long-term evolution of (a) DIN∶TP mass ratio; TP, DIN, and TN concentrations (µg L−1) and (b) bacteria (× 105 cell mL−1), phytoplankton (× 103 cell mL−1), zooplankton (ind L−1), and HNF abundances (× 102 cell mL−1). Error bars represent ± standard deviation (SD) of the mean. Period I: maximum depth > 10 m; Period II: maximum depth ranging from 4 to 10 m, Period III: maximum depth < 4 m. Significant differences at p < 0.05 between periods are indicated with letters.
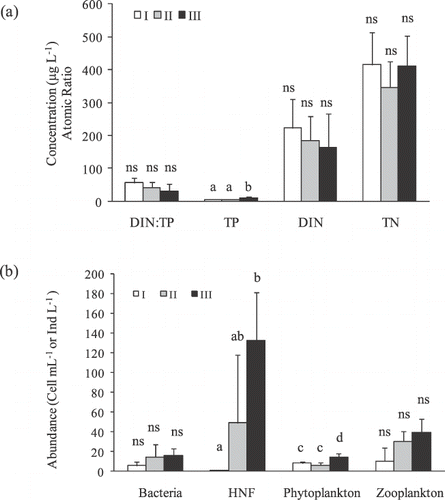
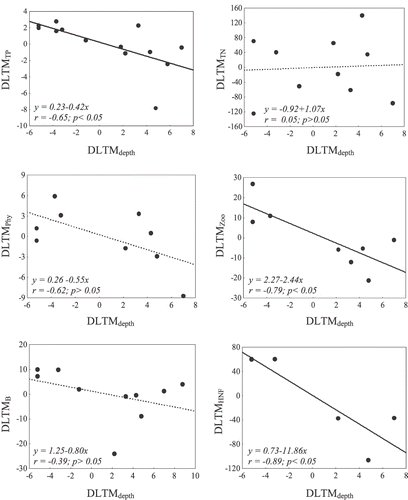
Figure 7 Scatterplots between DLTMdepth and DLTM for each water quality parameter (TP, TN, Phytoplankton, Zooplankton, Bacteria, and HNF). Solid regression lines are shown for significant relationships while dashed lines are shown for non-significant relationships.