Figures & data
FIGURE 1. Map of the study area showing the location of the study tree-limit ribbons and the area above 1900 m (shaded). Ribbons were T = Twynam (unburnt), I = Illawong (2 ribbons, one unburnt), P = Pounds Creek (unburnt), HC = Horse Camp (3 ribbons, one unburnt), W = Whites River (burnt), and K = Kerries (unburnt). The transect through five parallel ribbons begins at ribbon I; TC = Twynam Creek, PC = Pounds Creek and its northeasterly extension, e is the location of the two establishment-phase ribbons. The filled circle is the location of the seed-bearing snowgum branch.
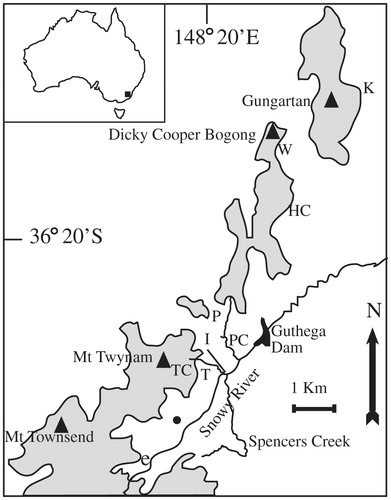
TABLE 1 Characteristics of snowgums within the study ribbons and physical/topographic data. UB = unburnt, B = burnt. Tree heights and stem ages could not be assessed accurately in burnt ribbons.
TABLE 2 Mean (± 1 standard error) of chemical soil attributes (nutrients, trace elements, minerals, and extractable ions) in soils immediately above, within, and below ribbons. Key: NH4, NO3, P, K, S: (mg kg-1); OC: organic carbon content (%); COND: conductivity (dS m mg-1); pH (Ca), pH (H2O): soil pH analyzed with calcium, water; Cu, Fe, Mn, Zn: (mg kg-1) extracted using diethylenetria-minepentacetic acid (DPTA); extractable ions of Al, Ca, Mg, K*, Na: (meq/100 g); K* is extractable K; Al (CaCl2), Bo (CaCl2): aluminum and boron extracted using calcium chloride (mg kg-1); OM: organic matter content (%).
TABLE 3 Maximum snow depths (cm) above, within, and below ribbons. UB = unburnt, B = burnt.
FIGURE 2. The arrangement of trees (filled circles) within an establishment-phase tree-limit ribbon and their calculated stem age; the scale is only for distance, tree girths are exaggerated but are correct relative to one another.
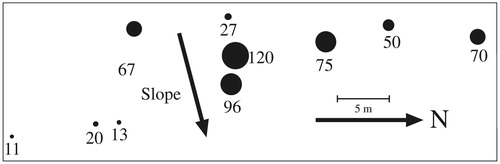
FIGURE 3. Profile view of parallel ribbons from the Illawong tree-limit ribbon (1) downhill to a frost hollow at the Snowy River. Figures below ribbons are the maximum calculated age for a tree stem in that ribbon and figures in parentheses are maximum lignotuber diameter (cm).
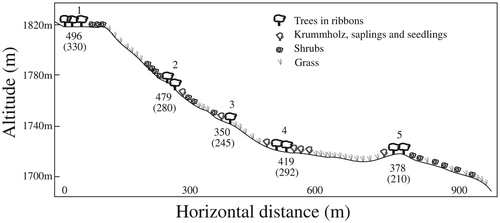
FIGURE 4. The age distribution of 130 seedlings and saplings below tree-limit ribbons by decade. Vertical bars indicate the number of snowgums along belt transects for the 10 years up to the date given.
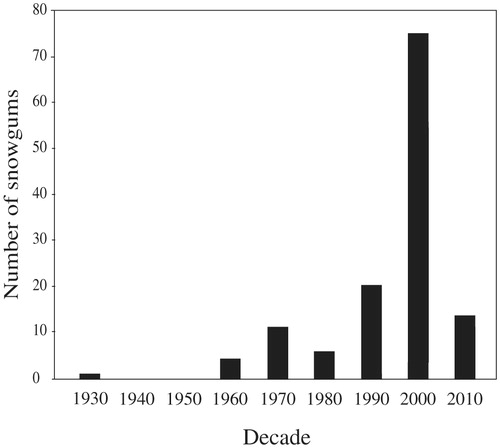
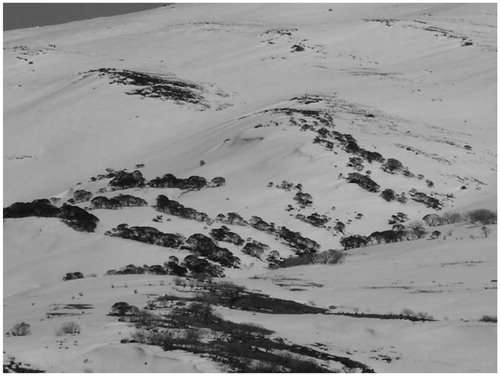
FIGURE 5. Parallel tree-limit ribbons on the southeast flanks of Mt. Twynam, Snowy Mountains, Australia.