Figures & data
TABLE 1 Plant and litter biomass in cattle- and sheep-grazed areas measured in June (n = 3) and October (n = 9). Mean and ± SE are shown.
TABLE 2 Total elemental and extractable nutrients in surface (0–10 cm) and deeper (10–20 cm) soils at the cattle- and sheep-grazed areas. Mean ± SE and the F and P statistic for the comparison between cattle- and sheep-grazed areas are shown (n = 3). SOM = soil organic matter.
FIGURE 1. Fluxes of CO2 from cattle- and sheep-grazed areas in June (n = 3) and October (n = 9). (a) Net ecosystem exchange of CO2, (b) gross ecosystem photosynthesis, and (c) ecosystem respiration. Mean and SE are shown. Positive values indicate efflux of CO2 and negative values uptake.
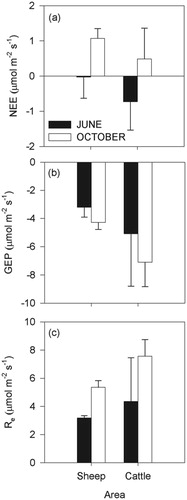
FIGURE 2. Regressions between (a) net ecosystem exchange of CO2 (NEE) and aboveground plant biomass in June 2008; (b) gross ecosystem photosynthesis (GEP) and photosynthetically active radiation (PAR) over the two measurement periods (i.e. June and October); and (c) ecosystem respiration (Re) and air temperature over the two measurement periods. Apart from the plant biomass, values shown are means from 10 records over a 10 min measurement series. Positive values indicate efflux of CO2 and negative values uptake.
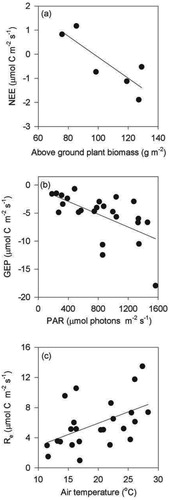
FIGURE 3. Soil respiration rates from soil turf samples incubated in the laboratory under contrasting moisture and temperature regimes from (a) sheepgrazed areas initial analysis, (b) sheep areas after 3 months' incubation, (c) cattle areas initial analysis, and (d) cattle-grazed areas after 3 months' incubation. Mean and SE are shown (n = 9). Positive values indicate efflux of CO2.
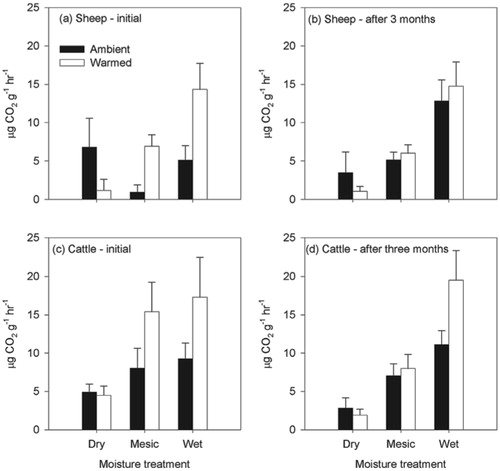
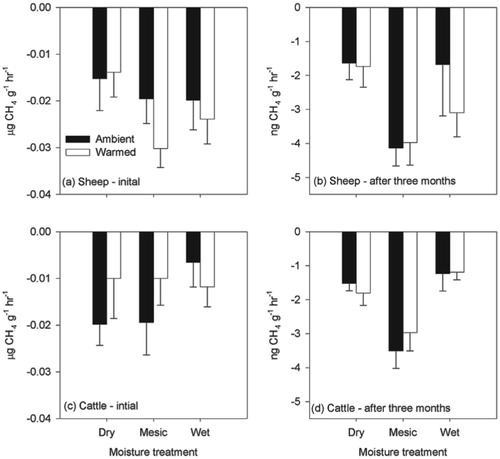
FIGURE 4. Methane fluxes from soil turf samples incubated in the laboratory under contrasting moisture and temperature regimes from (a) sheep areas initial analysis, (b) sheep areas after 3 months' incubation, (c) cattle areas initial analysis, and (d) cattle areas after 3 months' incubation. Mean and SE are shown (n = 9). Negative values indicate net oxidation of CH4. Note the different scales in the graphs with the initial (a and c) data compared to the data after three months (b and d). Negative values indicate uptake of CH4.