Figures & data
FIGURE 1. The landscape of the Tibetan Plateau and environment around the QOMS/CAS station. The bottom right picture is taken facing south.
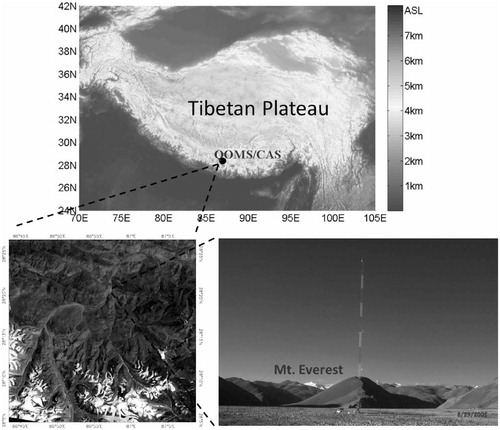
FIGURE 2. Diurnal and seasonal variations of (a) temperature, (b) relative humidity, (c) wind direction, (d) wind speed, and (e) water vapor content in the year of 2007.
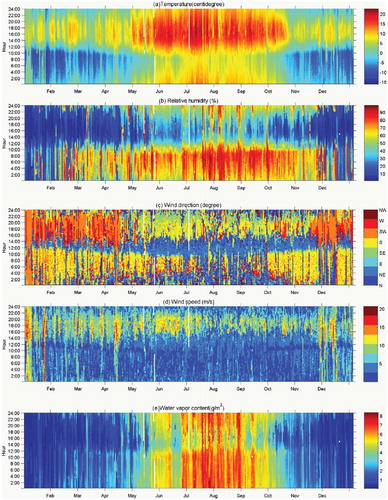
FIGURE 3. Monthly average of (a) air temperature, (b) relative humidity, (c) wind speed, and (d) pressure at QOMS/CAS. Vertical bars in these figures represent the standard deviations from the mean.
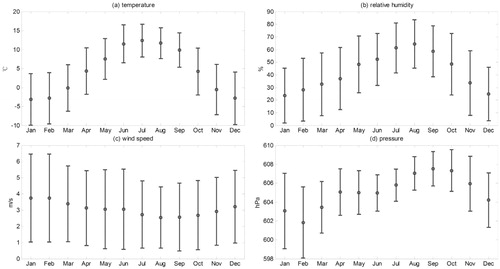
FIGURE 4. Seasonal means of diurnal variation of (a) downward shortwave radiation (DSR), (b) downward long-wave radiation (DLR), (c) upward shortwave radiation (USR), and (d) upward long-wave radiation (ULR) at QOMS/CAS. JFM (January-March), AMJ (April—June), JAS (July-September), OND (October-December).
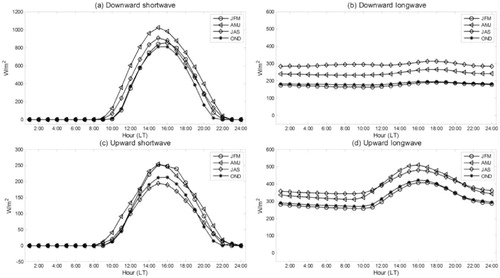
FIGURE 5. Diurnal cycle of the seasonal mean of (a) net radiation (Rn), (b) latent heat flux (LE), (c) sensible heat flux (H), and (d) ground heat flux (G) at QOMS/CAS, JFM (January-March), AMJ (April-June), JAS (July-September), OND (October-December).
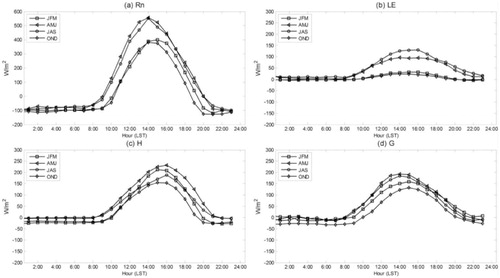
FIGURE 6. Variation of (a) albedo and (b) soil moisture (black) with precipitation (gray) from 1 June to 30 September 2007 at QOMS/CAS.
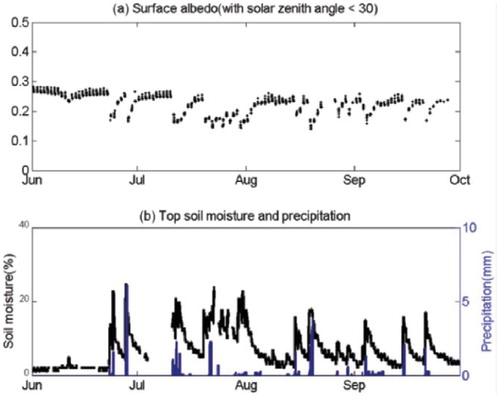
FIGURE 7. The scatter plot and fitting line between top soil moisture and albedo from June to September 2008.
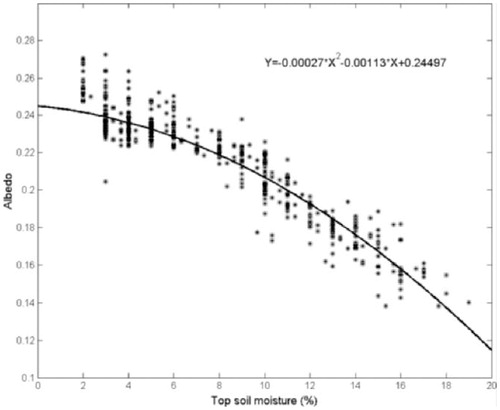
FIGURE 8. (a) scatter points between sensible heat flux (H) and net radiation (Rn), (b) scatter points between latent heat flux (LE) and net radiation (Rn) , (c) scatter points between LE and H + LE. Each soil moisture level is labeled with different color. Level 1, red color, 0–2.7% soil moisture; level 2, green, 2.7–6.1% soil moisture; level 3, blue, 6.1-9.5% soil moisture; level 4, yellow, 9.5–12.9% soil moisture; level 5, pink, 12.9–16.3% soil moisture.
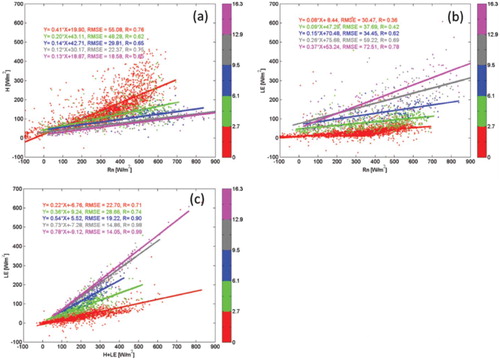
FIGURE 9. (a) Scatter plot and spline fitting functions between the ratio of sensible heat flux (H) and net radiation (Rn) and soil moisture level, (b) scatter plot and spline fitting functions between the ratio of latent heat flux (LE) and net radiation (Rn) and soil moisture level, and (c) scatter plot and spline fitting functions between evaporative fraction (LE/[H + LE]) and soil moisture.
![FIGURE 9. (a) Scatter plot and spline fitting functions between the ratio of sensible heat flux (H) and net radiation (Rn) and soil moisture level, (b) scatter plot and spline fitting functions between the ratio of latent heat flux (LE) and net radiation (Rn) and soil moisture level, and (c) scatter plot and spline fitting functions between evaporative fraction (LE/[H + LE]) and soil moisture.](/cms/asset/ddecdc74-d549-4ab2-a0a9-ac37dba13e70/uaar_a_11957629_f0012.jpg)
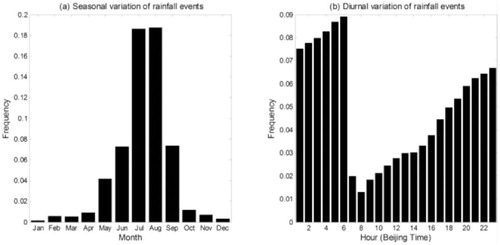
FIGURE 10. Statistical histograms of rainfall events: (a) seasonal variation by month, (b) diurnal variation using Beijing Time.