Figures & data
TABLE 1 List of butterfly species observed. Identifications were made with the help of Peña and Ugarte (Citation1996) and by consulting the collection at the Museo Nacional de Historia Natural (Santiago, Chile). Names are as per the Darwin Andean Butterfly Database (2010, http://www.andeanbutterflies.org/database.html) and distribution information from Peña and Ugarte (Citation1996).
FIGURE 1. MaoTau species accumulation curves showing expected species richness versus sampling effort (number of individuals encountered). A separate curve is plotted for each site along the transect.
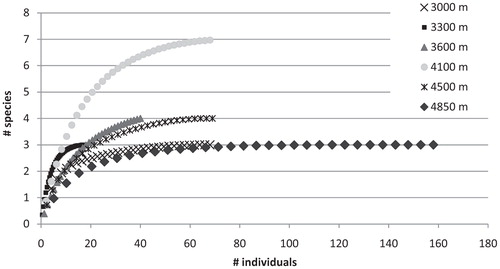
FIGURE 2. Butterfly species richness pattern along the elevational gradient. Temperature data is shown as December mean daily maximum and December mean daily minimum in °C, over the period 1991–1994 along an altitudinal transect 35 km north of our transect. Annual precipitation (in cm) data is from regional weather stations and is averaged over the period 1978–1985 and 1987–1988. Climate data is modified from Schmidt (Citation1999).
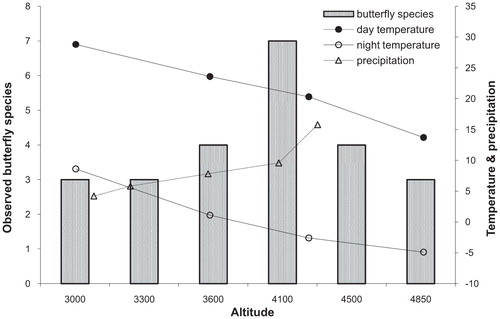
FIGURE 3. Butterfly abundance at each site between October 2008 and June 2009 (per 30 min. observation period). Temperature data (weekly average temperature between 1200 h and 1500 h from the sensor at 10 cm above the soil at each site) is shown in °C on the right-hand Y-axis. The bottom panel also shows precipitation events, estimated from abrupt peaks in humidity data from the APEX radio telescope weather station (5000 m elevation, 3 km east of our sixth site).
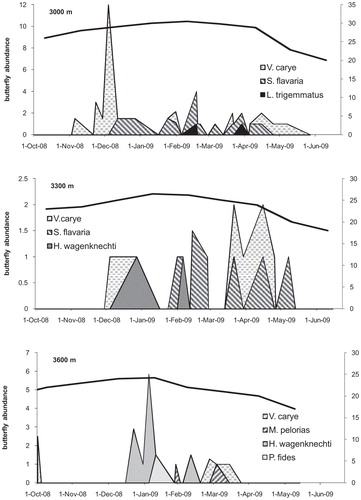
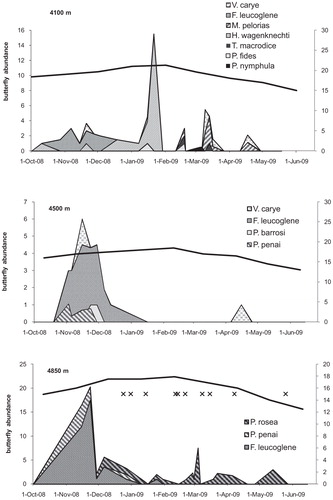
FIGURE 4. Mean midpoint and duration (in days) of the flight period of all species across the altitudinal gradient. Species found at only one site are represented by a point, whereas those found at several altitudes are represented by lines joining those points.
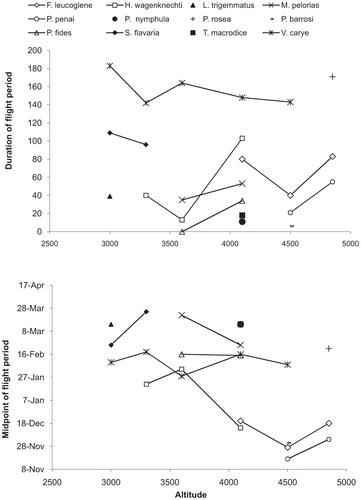
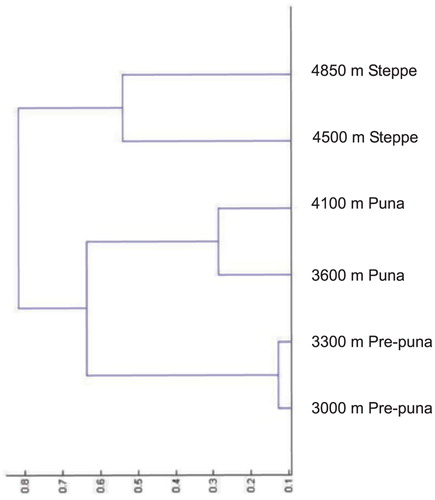
FIGURE 5. Dendrogram of butterfly community similarity among sites. Dendrograms illustrate the results of single linkage cluster analyses based on the Chao-Jaccard abundance-based similarity estimator. Values on the x-axis indicate the difference between sites or nodes. The dominant plant community at each site is given at the right.