Figures & data
FIGURE 1. Stordalen field site location at Abisko, northern Sweden.
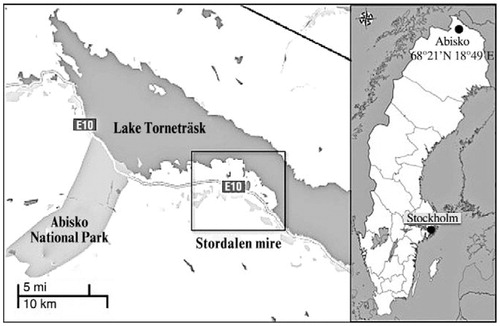
TABLE 1 pH and temperature values for the three different sites and months.
FIGURE 2. (a) Sedge mire, (b) Sphagnum mire, and (c) ombrotrophic bog: concentrations of total organic carbon (TOC), non-purgeable organic carbon (NPOC), and total nitrogen (TN) (both in peat and pore water), total organic nitrogen (TON) along the soil profile for the sampling months.
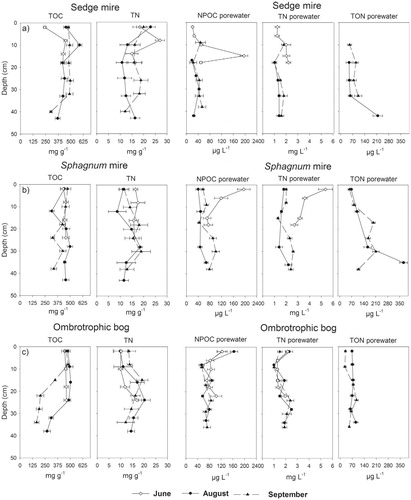
FIGURE 3. Methane concentration profiles for the three sampling months in the (a) sedge mire, (b) Sphagnum mire, and (c) ombrotrophic bog. The horizontal lines in (a) and (b) represent the position of the water table at the different sampling times. The black arrows indicate the active layer depth in June. Error bars represent the standard deviation of analyses conducted in triplicate.
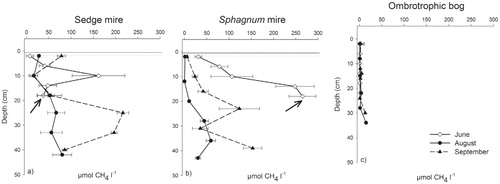
FIGURE 4. The 4 °C CH4 production response in peat from different depths of (a) sedge mire and (b) Sphagnum mire for the three sampling months. Error bars represent the standard deviation of analyses conducted in triplicate.
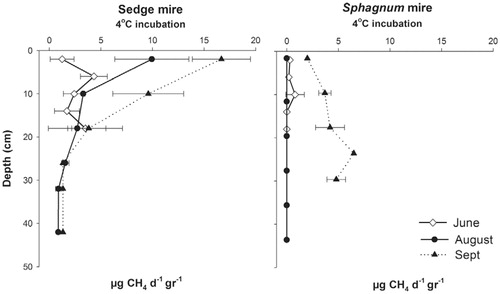
FIGURE 5. Methane production rates in incubated peat from different depths in the sedge mire [(a) August, (b) September], Sphagnum mire [(c) August, (d) September], and ombrotrophic bog [(e) August, (f) September]. Error bars represent the standard deviation of analyses conducted in triplicate.
![FIGURE 5. Methane production rates in incubated peat from different depths in the sedge mire [(a) August, (b) September], Sphagnum mire [(c) August, (d) September], and ombrotrophic bog [(e) August, (f) September]. Error bars represent the standard deviation of analyses conducted in triplicate.](/cms/asset/d9a845a2-f244-4bef-b67b-56b8f6af2034/uaar_a_11957634_f0009.jpg)
TABLE 2 Main biological coefficients for the sedge and Sphagnum mire in August and September (the numbers in parentheses indicate the standard deviation).
FIGURE 6. Methane production rate versus temperature showing Q10 relationships for incubated peat from the sedge (a–b) and Sphagnum (c–d) sites in August and September 2006. Peat depths corresponding to the different symbols are provided in the inset legends.
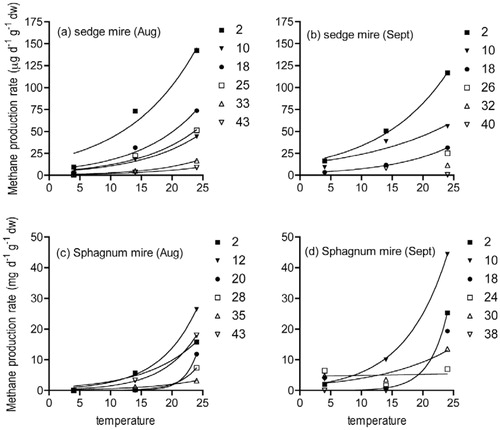
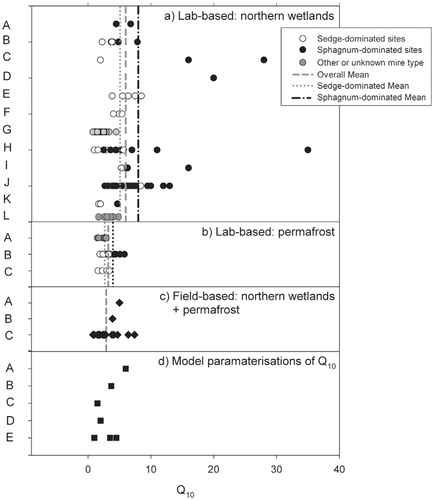
FIGURE 7. A comparison of Q10 values determined from laboratory incubations of soil (<50 cm depth) from (a) northern wetlands (non-Arctic), (b) Arctic wetlands where permafrost is present, (c) field-based studies in northern and Arctic wetlands, and (d) Q10 values used in numerical models of global or wetland carbon cycling. Key: (a) A—Frenzel and Karofeld (Citation2000), B—McKenzie et al. (Citation1998), C—Updegraff et al. (Citation1995), D—Nedwell and Watson (Citation1995), E—Westermann (Citation1993), F—Westermann and Ahring (Citation1987), G—Yavitt et al. (Citation2000), H—Bergman et al. (Citation1998), I—Dunfield et al. (Citation1993), J—Bergman et al. (Citation2000), K—Valentine et al. (Citation1994), L—Juottonen et al. (Citation2008). (b) A—Dutta et al. (Citation2006), B—this study, C—Heyer et al. (Citation2002). (c) A—Christensen et al. (Citation2003), B—Worthy et al. (Citation2000), C—Pelletier et al. (Citation2007). (d) A—Walter and Heimann (Citation2000), B—Frolking et al. (Citation2001), C—Gedney et al. (Citation2004), D—Hein et al. (Citation1997), E—Fung et al. (Citation1991).