Figures & data
FIGURE 1. Location map of the Svalbard drilling sites (400 m isolines). White patches represent snow/ice-covered areas.
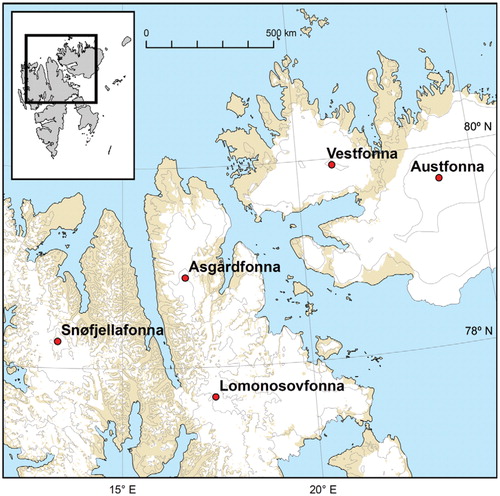
TABLE 1 Drilling site and ice core characteristics in the studied Svalbard regions.
FIGURE 2. Sulfate (in red) and nitrate (in blue) annually averaged concentrations at Snøfjellafonna, Vestfonna, Lomonosovfonna, Austfonna, and Asgårdfonna sites in Svalbard. Snow92, Asga93, Lomo97, Vest95, and Aust99 refer to the Snøfjellafonna Asgårdfonna, Vestfonna, Lomonosovfonna, and Austfonna ice caps drilled in 1992, 1993, 1995, 1997, and 1999, respectively.
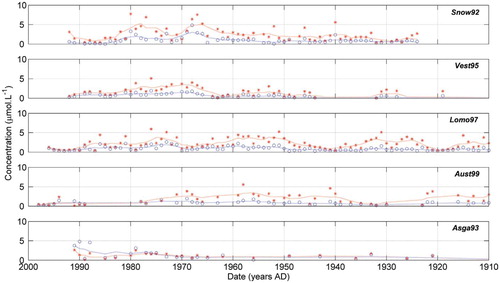
FIGURE 3. Annual emission estimates of SO2 and NOx from the principal contributing regions of the world (Tg.yr-1). S and L stand for data from Smith et al. (Citation2010) and Lamarque et al. (Citation2010), respectively. Note that the Japanese emissions are multiplied by 5 for better visualization.
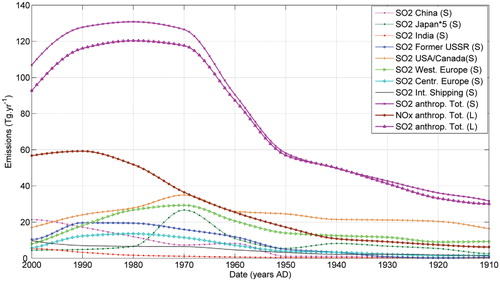
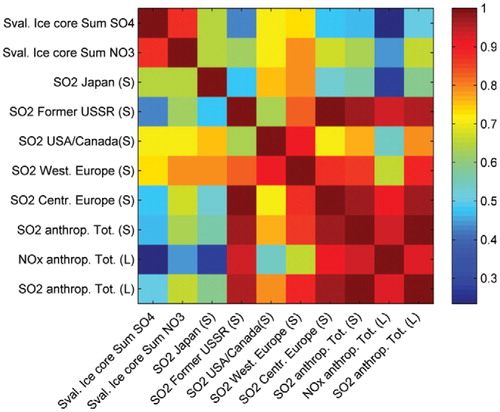
FIGURE 4. Pearson's correlations (significant at the 95% level) amongst the various source regions and Svalbard ice core concentrations (data years: 1910 to 1990). S and L stand for data from Smith et al. (Citation2010) and Lamarque et al. (Citation2010), respectively. Snow92, Asga93, Vest95, Lomo97, and Aust99 refer to the Snøfjellafonna, Asgårdfonna, Vestfonna, Lomonosovfonna, and Austfonna ice caps drilled in 1992, 1993, 1995, 1997, and 1999, respectively.
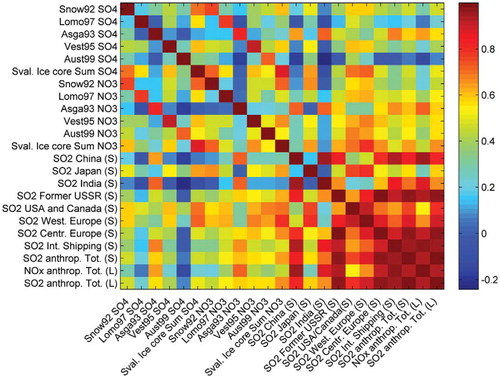
FIGURE 5. Pearson's correlations (significant at the 95% level) amongst sulfate and nitrate ice core concentrations from Svalbard (data years: 1910 to 1990).
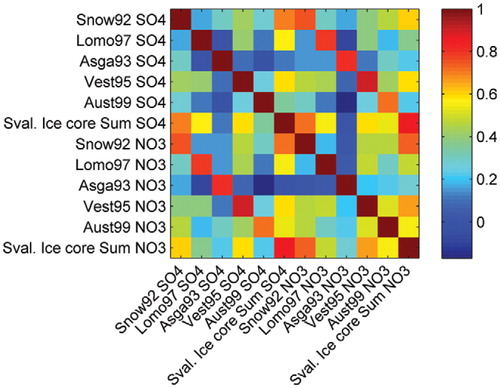
FIGURE 6. 20th century sulfate filtered, annually averaged composite profiles from 5 Svalbard sites.
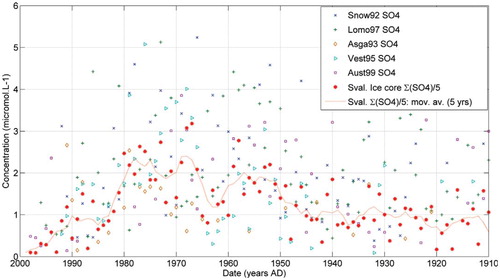
FIGURE 7. 20th century nitrate filtered, annually averaged composite profiles from 5 Svalbard sites.
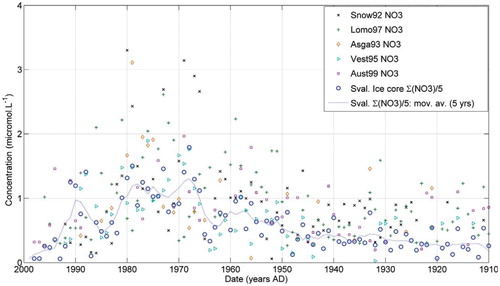
FIGURE 8. Annual emission estimates of SO2 and NOx from the principal contributing regions of the world (Tg.yr-1), compared to the composite profiles of sulfate and nitrate ice core concentrations (μmol.L-1). S and L stand for data from Smith et al. (Citation2010) and Lamarque et al. (Citation2010), respectively. Note that the Japanese emission profile is multiplied by 5 for better visualization.
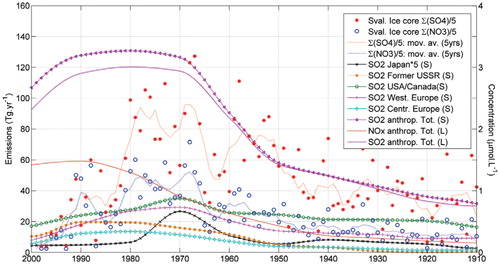
FIGURE 9. Pearson's correlation diagram (significant at the 95% level) amongst the most important source regions and composite ice core concentration profiles from Svalbard (data years: 1910 to 1990). S and L stand for data from Smith et al. (Citation2010) and Lamarque et al. (Citation2010), respectively.