Figures & data
FIGURE 1. Location and dominant land cover (CitationHomer et al., 2007) of the Anaktuvuk River and Kuparuk River wildfires of 2007.
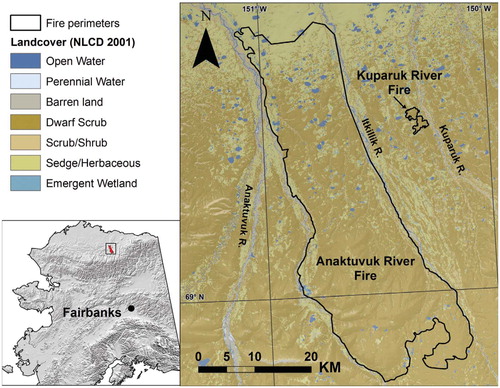
FIGURE 2. Arctic tundra burn severity scene model components for the fire include: (a) unburned prefire, (b) post-fire but pre-green-up, (c) low severity plot with unburned inclusions, (d) moderate severity with elements of char and non-photosynthetic vegetation (NPV), (e) post green-up, with tussock regeneration, and (f) high severity with example of oxidized soils. Photos courtesy of R. Jandt, Alaska Fire Service.
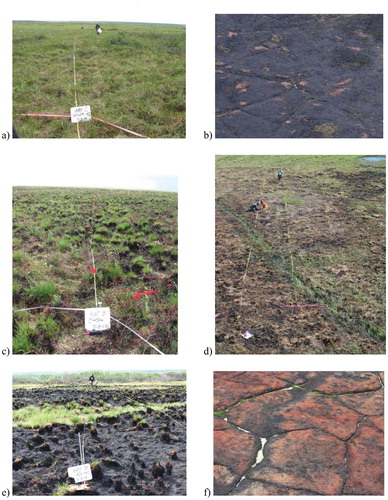
TABLE 1 Image dates and pairings created to test the utility of downsampled MODIS data modeled from the STARFM algorithm (CitationGao et al., 2006).
TABLE 2 Spectral indices assessed for correlation with burn severity metrics. Equations for the production of the single date transforms or indices are listed first, then the equation given below for the bi-temporal spectral index.
TABLE 3 Correlations (R2) between the 10 spectral metrics and the 3 metrics of burn severity: Surface (SURF), Substrate (SUB), and Composite Burn Index (CBI). Correlations with p-values less than 0.001 are considered highly significant.
TABLE 4 Spearman rank correlations (R2) between the 10 spectral metrics and the 3 metrics of burn severity: Surface (SURF), Substrate (SUB), and Composite Burn Index (CBI). Correlations with P -values less than 0.001 are considered highly significant.
TABLE 5 Confusion matrix indicating the proportional change by class in burn severity across the landscape between the Initial and Extended Assessments.
FIGURE 3. Final Initial Assessment dNBR (differenced Normalized Burn Ratio) map for the Anaktuvuk River Fire, with Kuparuk Fire (also burned in 2007) for comparison.
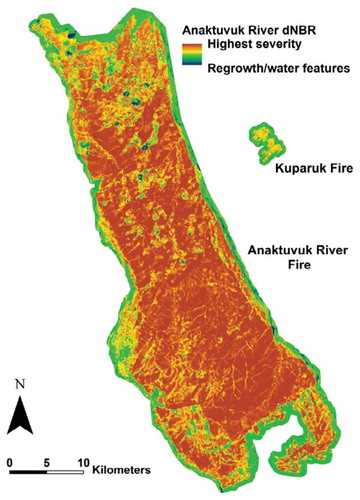
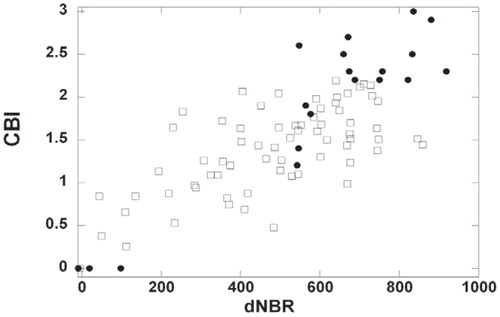
FIGURE 4. All Composite Burn Index (CBI) plots from Anaktuvuk River Fire (solid circles) and three fires from Allen and Sorbel (Citation2008) (open squares) regressed to dNBR value for associated pixel, with regression line (y = 0.0023x + 0.3144).