Figures & data
FIGURE 1. Two Salix species from Toolik Field Station, Alaska, (a) S. pulchra is a dominant deciduous shrub species with a low canopy profile in moist tussock sites, while (b) S. glauca is commonly found as a taller shrub in dry heath sites. Eriophyid mite-induced galls on leaves of (c) S. pulchra and (d) S. glauca. Arrows show ungalled leaves on the same shoot as galled leaves.
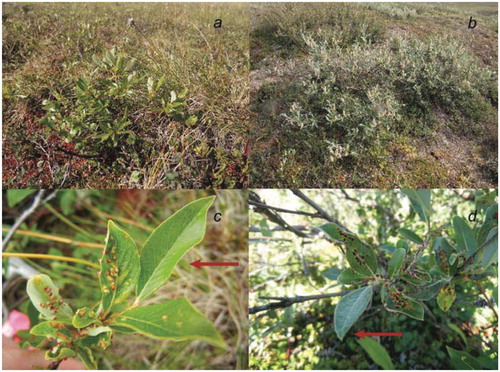
FIGURE 2. (a, e) Net photosynthetic capacity Amax , (b, f) stomatal conductance gs , (c, g) instantaneous water use efficiency WUE, and (d, h) evapotranspiration E measured in galled, neighboring ungalled, and ‘control’ leaves on two species of Salix from Toolik Field Station, Alaska. Different letters indicate a significant difference between groups at P < 0.05 (ANOVA followed by Tukey's multiple comparison tests). Bars are mean + 1 SEM.
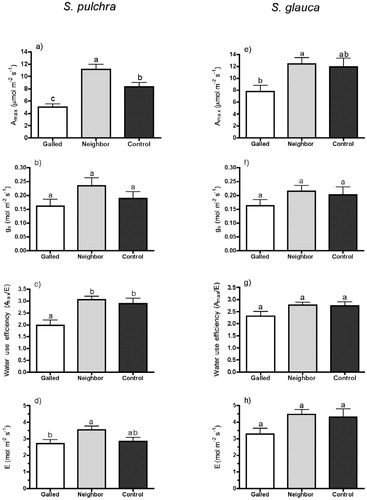
FIGURE 3. Total pigment ([a, d] chlorophyll and [b, e] anthocyanin) concentrations and (c, f) chlorophyll fluorescence FV /FM measured in galled, neighboring ungalled, and ‘control’ leaves on two species of Salix from Toolik Field Station, Alaska. Pigment concentrations were measured separately for galled and remaining ungalled leaf tissues in both species. Different letters indicate a significant difference between groups at P < 0.05 (ANOVA followed by Tukey's multiple comparison tests). Bars are mean + 1 SEM.
![FIGURE 3. Total pigment ([a, d] chlorophyll and [b, e] anthocyanin) concentrations and (c, f) chlorophyll fluorescence FV /FM measured in galled, neighboring ungalled, and ‘control’ leaves on two species of Salix from Toolik Field Station, Alaska. Pigment concentrations were measured separately for galled and remaining ungalled leaf tissues in both species. Different letters indicate a significant difference between groups at P < 0.05 (ANOVA followed by Tukey's multiple comparison tests). Bars are mean + 1 SEM.](/cms/asset/789e4b1a-6193-4171-9d64-566c61c63c02/uaar_a_11957651_f0003.jpg)
TABLE 1 Starch, soluble sugar concentrations (g/100 g dry mass), percent carbon (C) and nitrogen (N), and C:N ratio in galls, remaining leaf tissue, neighboring gall-free leaves, and leaves from gall-free control plants on Salix pulchra and S. glauca from Toolik Lake, Alaska. Values are mean (SD). Values with the same letter are not different at P = 0.05 level of significance. * P < 0.05, ** P < 0.01, *** P < 0.001.