Figures & data
FIGURE 1. (A) Precipitation and (B) maximum and minimum air temperature at the Jindallaebat Weather Station, Mount Halla, which is located near Site A (at 1500 m), and midday characterization of chlorophyll fluorescence (Fv/Fm in C, Fm, in D, FO in E, dark-adapted for a minimum of 15 min) from needles of Korean fir growing at different altitudes (1500 m, ◯; 1671 m, ▽; 1800 m, □) from June 2010 through May 2011. The vertical dotted line denotes the transition from 2010 to 2011. Each value in C, D, and E represents the mean ± standard deviation of 5 different trees. Significantly different values (evaluated by one-way ANOVA test, p < 0.01) among each altitude are marked by an asterisk.
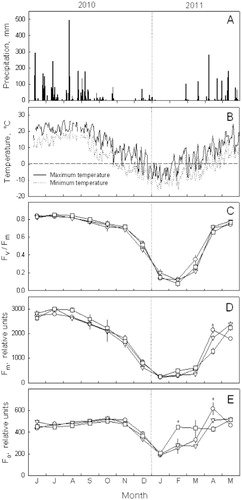
FIGURE 2. Characterization of the Chi a fluorescence transient O-J-I-P from needles of Korean fir trees growing at the altitudes of 1500 m (--), 1671 m (……), and 1800 m (-) in (A) July, (B) February, and (C) April. Each transient represents the mean of five separate measurements.
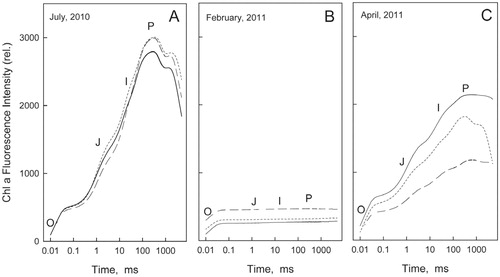
FIGURE 3. (A) Total Chl a+b relative to needle fresh weight, (B) the conversion state of the xanthophyll cycle, (C) neoxanthin relative to the total xanthophyll cycle pool, and (D) lutein relative to the total xanthophyll cycle pool in needles of Korean fir growing at three altitudes and collected during three seasons (July = J, February = F, or April = A). V = violaxanthin, A = antheraxanthin, Z = zeaxanthin, N = neoxanthin, and L = lutein. Each column and error bar represent the mean ± standard deviation of three different trees. Significant differences (determined by two-way ANOVA and Duncan's multiple range test, p < 0.05) among the means are indicated by the different letters.
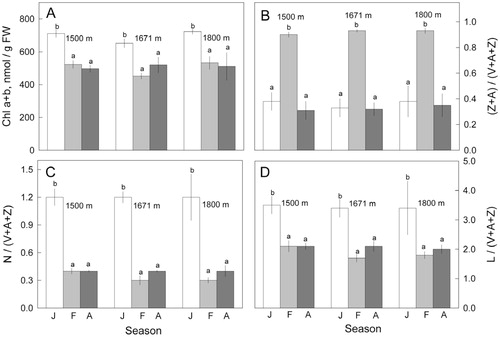
TABLE 1 Chlorophyll contents on a fresh weight (FW) basis and chlorophyll a/chlorophyll b ratio from needles of Korean fir trees growing at three altitudes on Mount Halla and collected during three seasons. Each value represents the mean ± standard deviation of three different trees. Within each column, significantly different values (evaluated by two-way ANOVA and Duncan's multiple range test, p < 0.05) are indicated by the different letters.
TABLE 2 Carotenoid contents on a fresh weight (FW) basis and the ratio of zeaxanthin (Z) to total xanthophyll cycle pool (violaxanthin + antheraxanthin + zeaxanthin = V+A+Z) in needles of Korean fir trees growing at three altitudes on Mount Halla and collected during three seasons. N = neoxanthin, L = lutein, and β-C = β-carotene. Each value represents the mean ± standard deviation of three different trees. Within each column, significantly different values (evaluated by two-way ANOVA and Duncan's multiple range test, p < 0.05) are indicated by the different letters.
TABLE 3 The ratios of neoxanthin (N), lutein (L), zeaxanthin (Z), the total xanthophyll cycle pool violaxanthin + antheraxanthin + zeaxanthin (V+A+Z), and β-carotene (β-C) to Chi a + b in needles of Korean fir trees growing at three altitudes on Mount Halla and collected during three seasons. Each value represents the mean ± standard deviation of three different trees. Within each column, significantly different values (evaluated by two-way ANOVA and Duncan's multiple range test, p < 0.05) are indicated by the different letters.
FIGURE 4. Zeaxanthin content of needles from Korean fir trees growing at three altitudes in February 2011 (A) on a fresh weight basis, and (B) relative to the total chlorophyll a + b content. Each column and error bar represents the mean ± standard deviation of three different trees. For significant differences, see and .
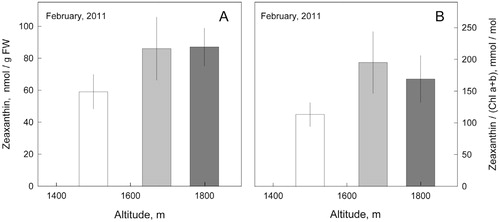
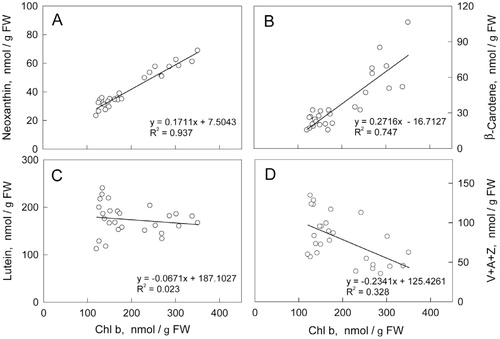
FIGURE 5. Relationships between chlorophyll b level and the levels of (A) neoxanthin, (B) β-carotene, (C) lutein, and (D) the total pool of xanthophyll cycle carotenoids in needles of Korean fir trees growing at three altitudes and collected in three seasons (July, February, and April). See Materials and Methods for additional information.