Figures & data
FIGURE 1. Skiing (S) and non-skiing (NS) areas within the study area in Tena Valley, Central Spanish Pyrenees, based on aerial photographs taken in (a) 1981 and (b) 2000. The western boundary of the map is the western limit of Panticosa municipality.
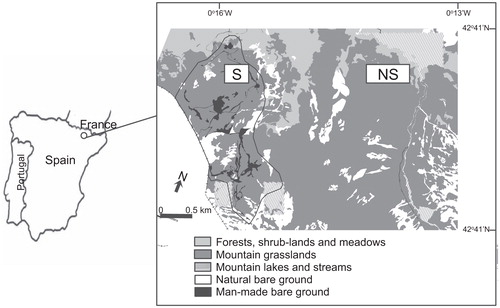
FIGURE 2. Livestock density (livestock units per hectare, LU ha -1) in Panticosa Municipality, Central Spanish Pyrenees, between 1970 and 2005.
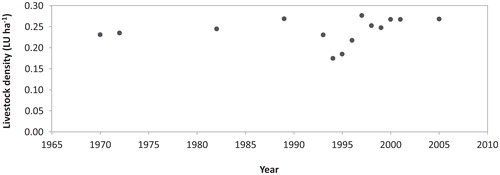
TABLE 1 Mean (SE) diversity (H’), evenness, local and regional richness, and beta-diversity of plant species in a skiing area and a non-skiing area in the Tena Valley, Central Spanish Pyrenees, based on plot sampling in 1972 and 2005. Statistical comparison between years based on Wilcoxon's Paired-Sample Test. For Diversity, Evenness, and Richness, N = 36; for beta-diversity, N = 12.
TABLE 2 Mean (SE) Sorensen's Similarity Index between paired transects for each combination of two dates in the non-skiing area (N = 72) and the skiing area (N = 99). Statistical comparison between areas based on Student's t-test.
TABLE 3 Composition of plant communities in a skiing area and a non-skiing area in the Tena Valley, Central Spanish Pyrenees, based on inventories in 1972 and 2005. Ruderal habitat based on Ferrer (Citation1981), Villar et al. (Citation1997–2001), Aeschimann et al. (Citation2004), and IPE-DGA (Citation2005); regenerative strategy and species soil nutrient level preference based on Hill et al. (Citation2004). Only plant species with cover >1% are included.
TABLE 4 Mean (SE) cover (%) and relative abundance (%) of grasses, legumes, and forbs, and mean (SE) Ellenberg Nitrogen Index (N-Index) (CitationHill et al., 2004) in a skiing area and a non-skiing area in the Tena Valley, Central Spanish Pyrenees, based on inventories in 1972 and 2005. N = 40. Statistical comparisons between years based on Wilcoxon's Paired-Sample Test.
TABLE 5 Mean (SE) cover (%) and relative abundance (%) of plant species that use either rhizomes or seeds as regenerative strategy in a skiing area and a non-skiing area in the Tena Valley, Central Spanish Pyrenees, based on inventories in 1972 and 2005. N = 40. Statistical comparisons between years based on Wilcoxon's Paired-Sample Test.
TABLE 6 Mean (SE) cover (%) and relative abundance (%) of ruderal plants and pastoral value in a skiing area and a non-skiing area in the Tena Valley, Central Spanish Pyrenees, based on inventories in 1972 and 2005. N = 40. Statistical comparisons between years based on Wilcoxon's Paired-Sample Test.